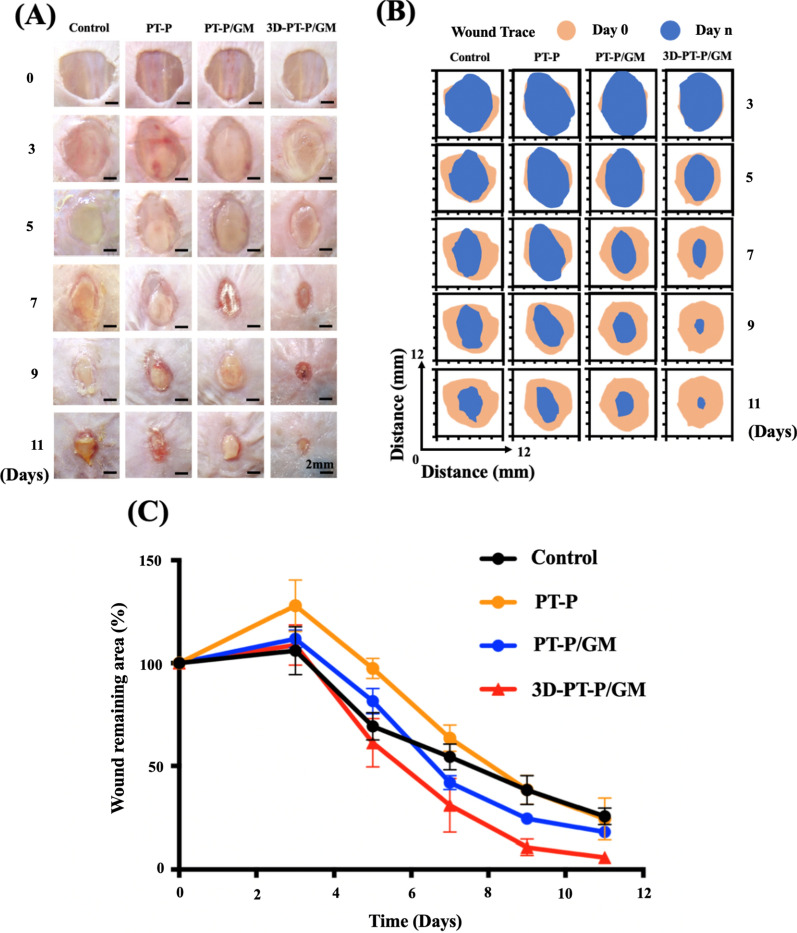
Fig. 5.
The effect of the 3D hydrogel/nanofiber composite scaffolds on diabetic wound healing. A Optical pictures of the wound areas for different groups on 0, 3, 5, 7, 9, 11 days post-surgery. B Schematic diagram of the remaining wound areas for different group in vivo (brown, wound areas on day 0; blue, wound areas on day n). C Statistical analysis of wound remaining areas in different groups on 0, 3, 5, 7, 9, 11 days post-surgery. Values are expressed as mean ± standard deviation (SD) (n = 3) (*P < 0.05, **P < 0.01, ***P < 0.001)

