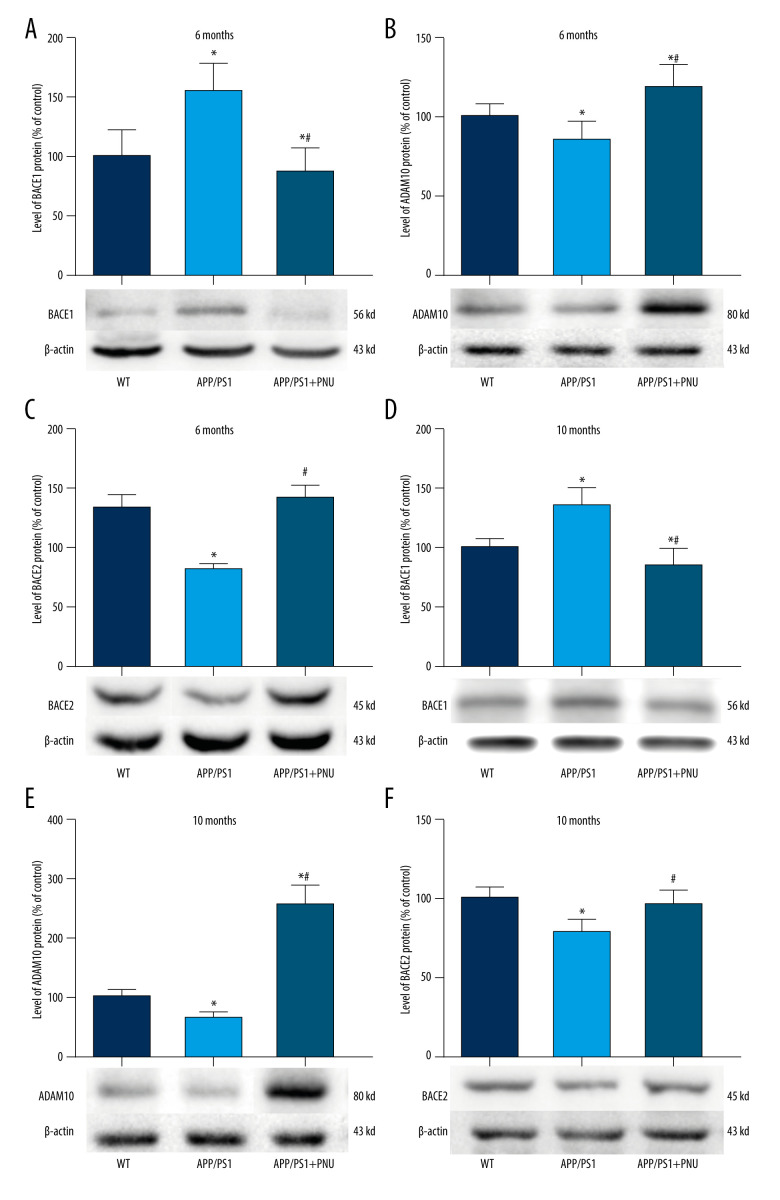
Figure 5.
Western blot for BACE1, ADAM10, and BACE2 in the brains of APP/PS1 mice. (A, D) Levels of BACE1 at 6 and 10 months of age. (B, E) Levels of ADAM10 at 6 and 10 months of age. (C, F) Levels of BACE2 at 6 and 10 months of age. The values presented are means±SD of n=10 mice. * P<0.05 compared to the wild-type (WT) group; # P<0.05 compared to the APP/PS1 group, as determined by analysis of variance (ANOVA), followed by the Tukey HSD test.

