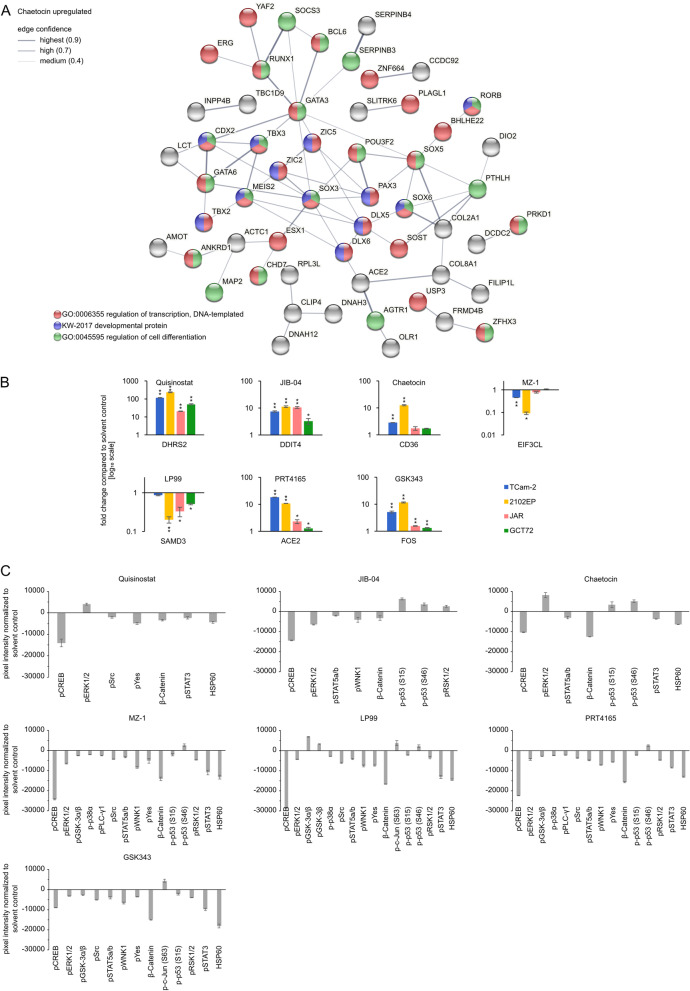
Fig. 4.
Epi-drug treatments induced deregulations in expression of transcriptional regulators and changes in kinase signaling pathways. A STRING interaction prediction of upregulated genes in Chaetocin treated (16 h) 2102EP cells. B qRT-PCR validation of selected genes in four GCT cell lines (n = 3). Asterisks indicate significant changes between treatment and solvent control (*p < 0.05, **p < 0.005). C Densitometric analysis of signals from the human phospho-kinase array membranes (n = 2); normalized to solvent control of each tested drug. Cells were treated for 16 h with indicated epi-drugs. See also Additional file 9: Fig. S9 A–D. p: phosphorylated protein.

