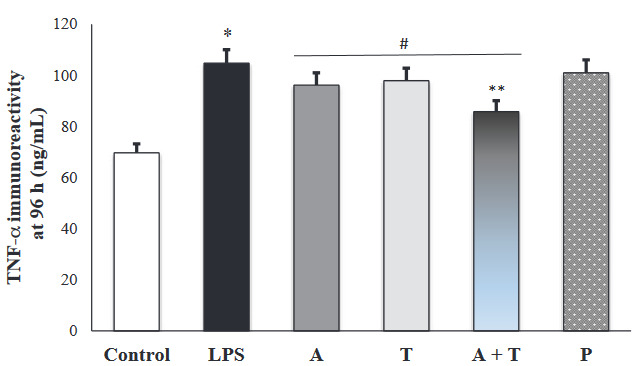
Figure 4b.

Immunoreactivity intensity of TNF-α in each experimental group at 96 h (*: p < 0.001 vs. control, **: p < 0.05 vs. prednisolone group, #: p < 0.05 vs. LPS group).

Immunoreactivity intensity of TNF-α in each experimental group at 96 h (*: p < 0.001 vs. control, **: p < 0.05 vs. prednisolone group, #: p < 0.05 vs. LPS group).