
Figure 2.
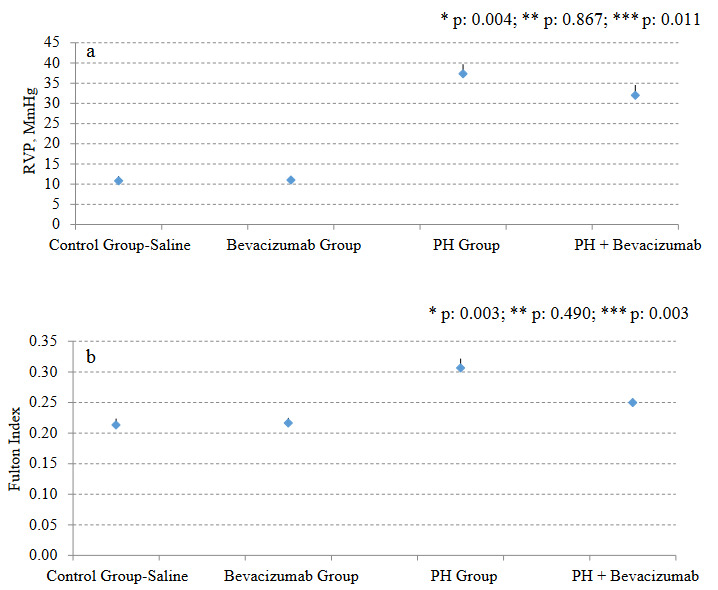
a. RVP measurements of the experiment groups; b. Fulton Index measurements of the experiment groups. Mean, and SD of the measurements were provided in the figures. P value to define statistical significance for comparisons of control group - saline vs bevacizumab group, and PH group vs PH + Bevacizumab group was 0.025. *: control group - saline vs PH group; **: control group - saline vs Bevacizumab group; ***: PH group vs PH + Bevacizumab group.