
Figure 3:
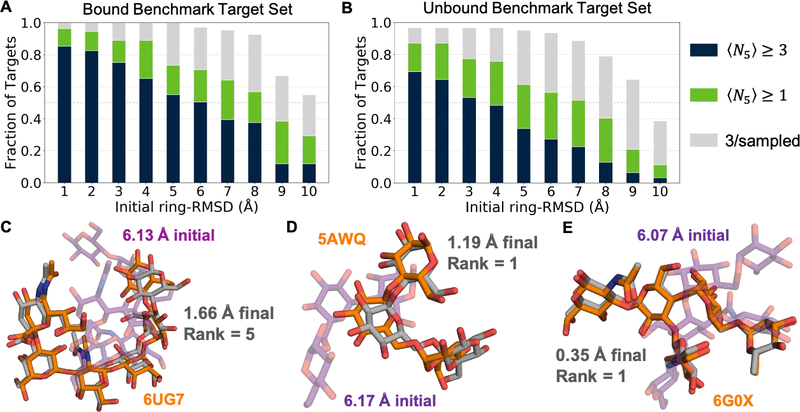
Summary of GlycanDock docking benchmark performance (A) GlycanDock 〈N5〉 performance on 109 bound protein–glycoligand targets as a function of initial ring-RMSD bin. Blue bars represent the fraction of targets that achieved 〈N5〉 ≥ 3. Green bars represent the fraction of targets that achieved 〈N5〉 ≥ 1.0 (the threshold for docking success). Gray bars represent the fraction of targets that sampled at least 3 near-native models overall but failed to rank them among the 5-top-scoring. (B) Same as (A), but on the 62 targets of the unbound benchmark set. (C–E) Glycoligand conformation from the bound crystal structure (orange) compared to conformation after the Stage 1 random perturbation (purple, transparent) and the final conformation (gray) after GlycanDock sampling for three example targets. Protein backbones omitted for clarity.