Figure 4:

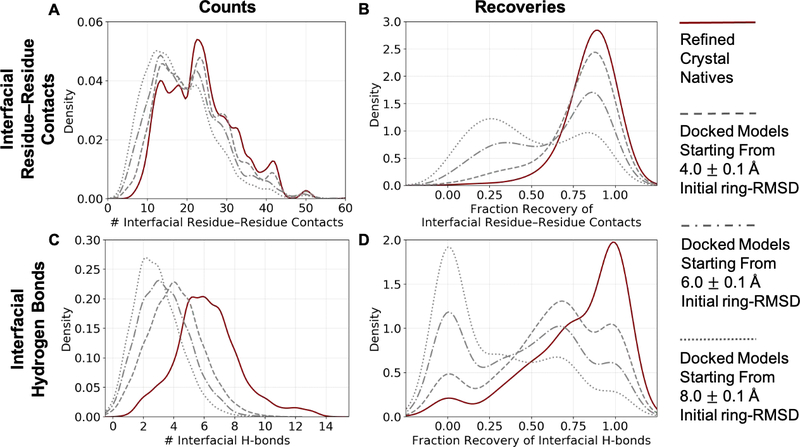
Counts and recovery of biophysical features by the 50-top-scoring GlycanDock models of each target from the bound benchmark set. (A) Distributions of the count of interfacial residue–residue contacts by the 50-top-scoring GlycanDock models per target predicted starting from input structures of 4.0, 6.0, and 8.0 Å initial ring-RMSD (gray dashed, dash-dot, and dotted lines, respectively). The distribution of the count of interfacial residue–residue contacts after GlycanDock crystal refinement (solid, maroon) serves as a reference. (B) Distributions of the recovery of native interfacial residue–residue contacts by the 50-top-scoring GlycanDock models per target. (C) Same as (A), but for the count of interfacial hydrogen bonds. (D) Same as (B), but for the recovery of interfacial hydrogen bonds. Discrete data are smoothed using kernel density fits using Seaborn81 (kdeplot), resulting in some curves extending below fractions of 0.0 and above 1.0. Bin widths of 1.0 and 0.5 were used to fit the counts of interfacial residue–residue contacts and hydrogen bonds, respectively, and a bin width of 0.1 was used to fit the recoveries.
