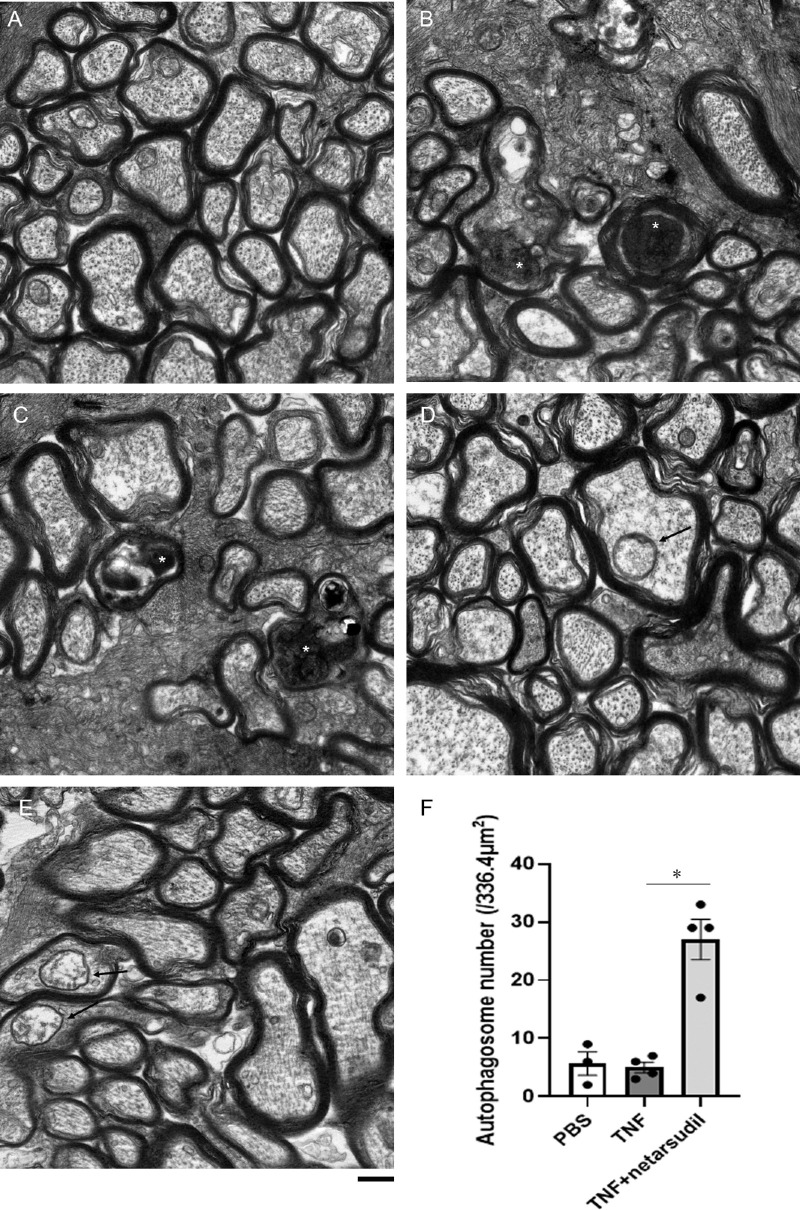
Figure 2.
Electron microscopic study of axons 2 weeks following intravitreal administration of (A) PBS, (B, C) TNF, or (D, E) 20 pmol netarsudil + TNF. Degenerating axons (white asterisks) in the B and C TNF group. Autophagosomes inside axons (black arrows) in the D and E netarsudil + TNF group. Scale bar: 500 nm. (F) Autophagosome numbers in axons; n = 3 to 4 per experimental group. *P < 0.05.

