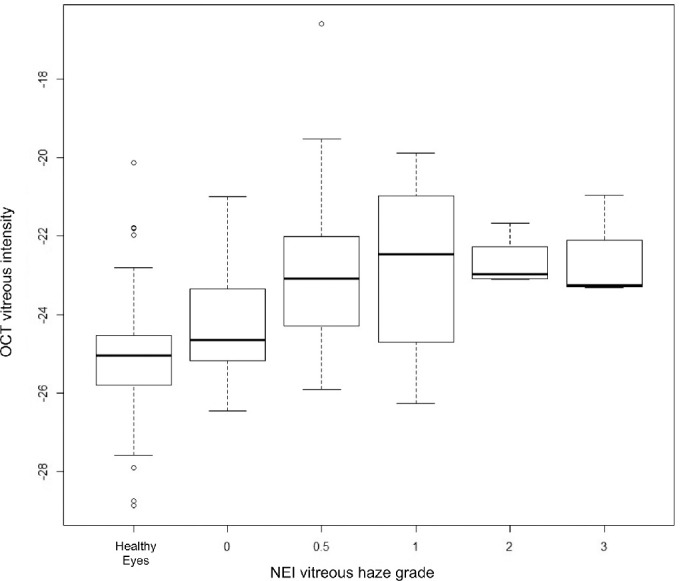
Figure 3.

Box and whisker plot showing median of OCT vitreous intensity measurements in each NEI vitreous haze grade. Minimum point is 1.5 × IQR below first quartile, and maximum point is 1.5 × IQR above first quartile. Circles denote outliers.

Box and whisker plot showing median of OCT vitreous intensity measurements in each NEI vitreous haze grade. Minimum point is 1.5 × IQR below first quartile, and maximum point is 1.5 × IQR above first quartile. Circles denote outliers.