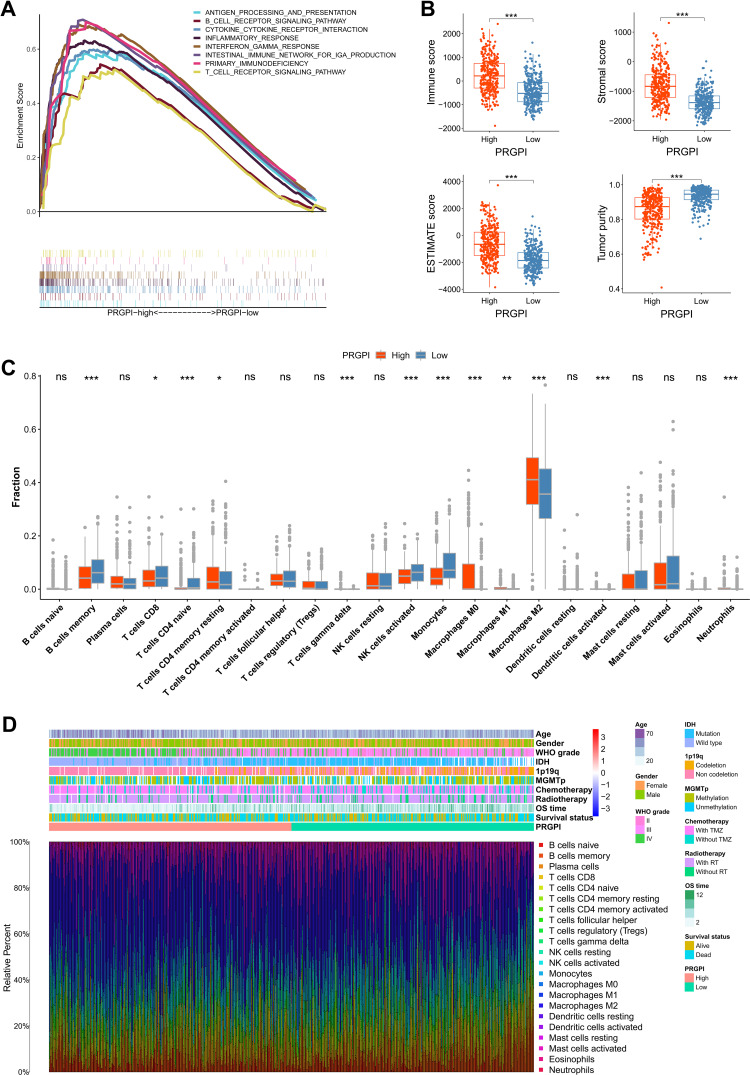
Figure 5.
The immune microenvironment of different PRGPI subgroups in CGGA693 cohort. (A) Gene set enrichment analysis (GSEA) in PRGPI-high group (p < 0.05, FDR < 0.25). (B) The comparison of immune score, stromal score, ESTIMATE score and tumor purity between PRGPI-high and PRGPI-low groups. (C) The infiltration of 22 immune cells in PRGPI-high and PRGPI-low groups. (D) The proportions of 22 immune cells, and the clinicopathologic characteristics of different PRGPI subgroups. * p<0.05, ** p<0.01, *** p<0.001, and ns No significance.

