
FIGURE 4.
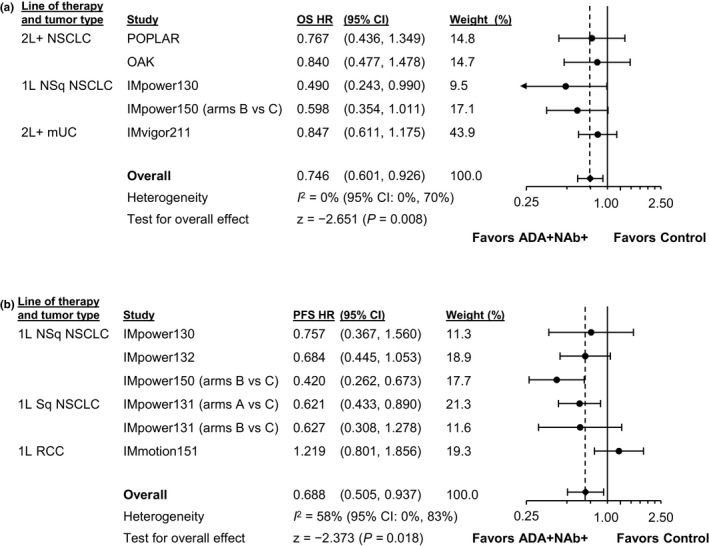
Meta‐analysis comparing ADA+/NAb+ experimental‐arm patients to adjusted control‐arm patients. Forest plots for (a) OS and (b) PFS are shown only for studies with an overall treatment effect. 1L, first line; 2L+, second line and beyond; ADA, anti‐drug antibody; CI, confidence interval; HCC, hepatocellular carcinoma; HR, hazard ratio; mUC, metastatic urothelial carcinoma; NAb, neutralizing (anti‐drug) antibody; NSCLC, non‐small cell lung cancer; NSq, nonsquamous; OS, overall survival; PFS, progression‐free survival; RCC, renal cell carcinoma; SCLC, small cell lung cancer; Sq, squamous