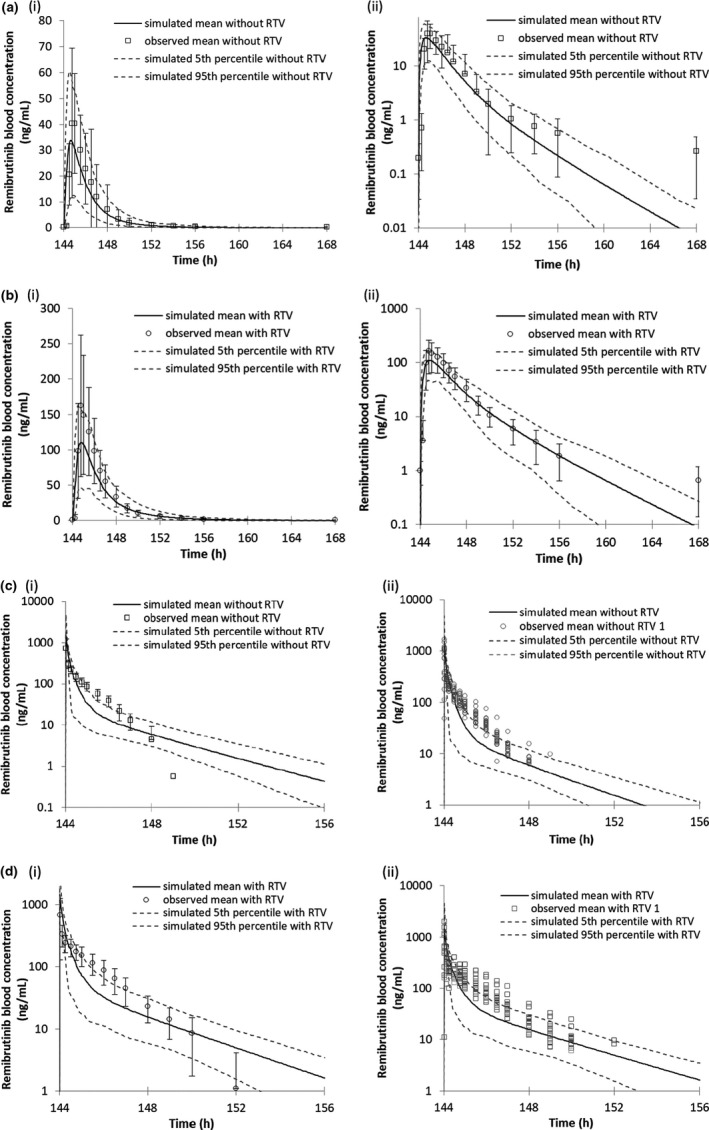
FIGURE 2.

PBPK model predicted and observed remibrutinib blood concentrations when co‐administered with the strong CYP3A4 inhibitor ritonavir. All graphs (i) are linear and (ii) logarithmic. Black lines represent the simulated mean remibrutinib blood concentrations after multiple daily oral doses of 20 mg at days 5 and 7, 50 mg at days 1–3 and 6 without ritonavir. (a) Remibrutinib 20 mg p.o. day 7 with ritonavir 100 mg b.i.d. (b) Remibrutinib 20 mg p.o. day 7 without ritonavir 100 mg b.i.d. (c) Remibrutinib 20 mg i.v. day 7 with ritonavir 100 mg b.i.d. (d) Remibrutinib 20 mg i.v. day 7 without ritonavir 100 mg b.i.d. PBPK, physiologically‐based pharmacokinetic; RTV, ritonavir
