
Figure 4.
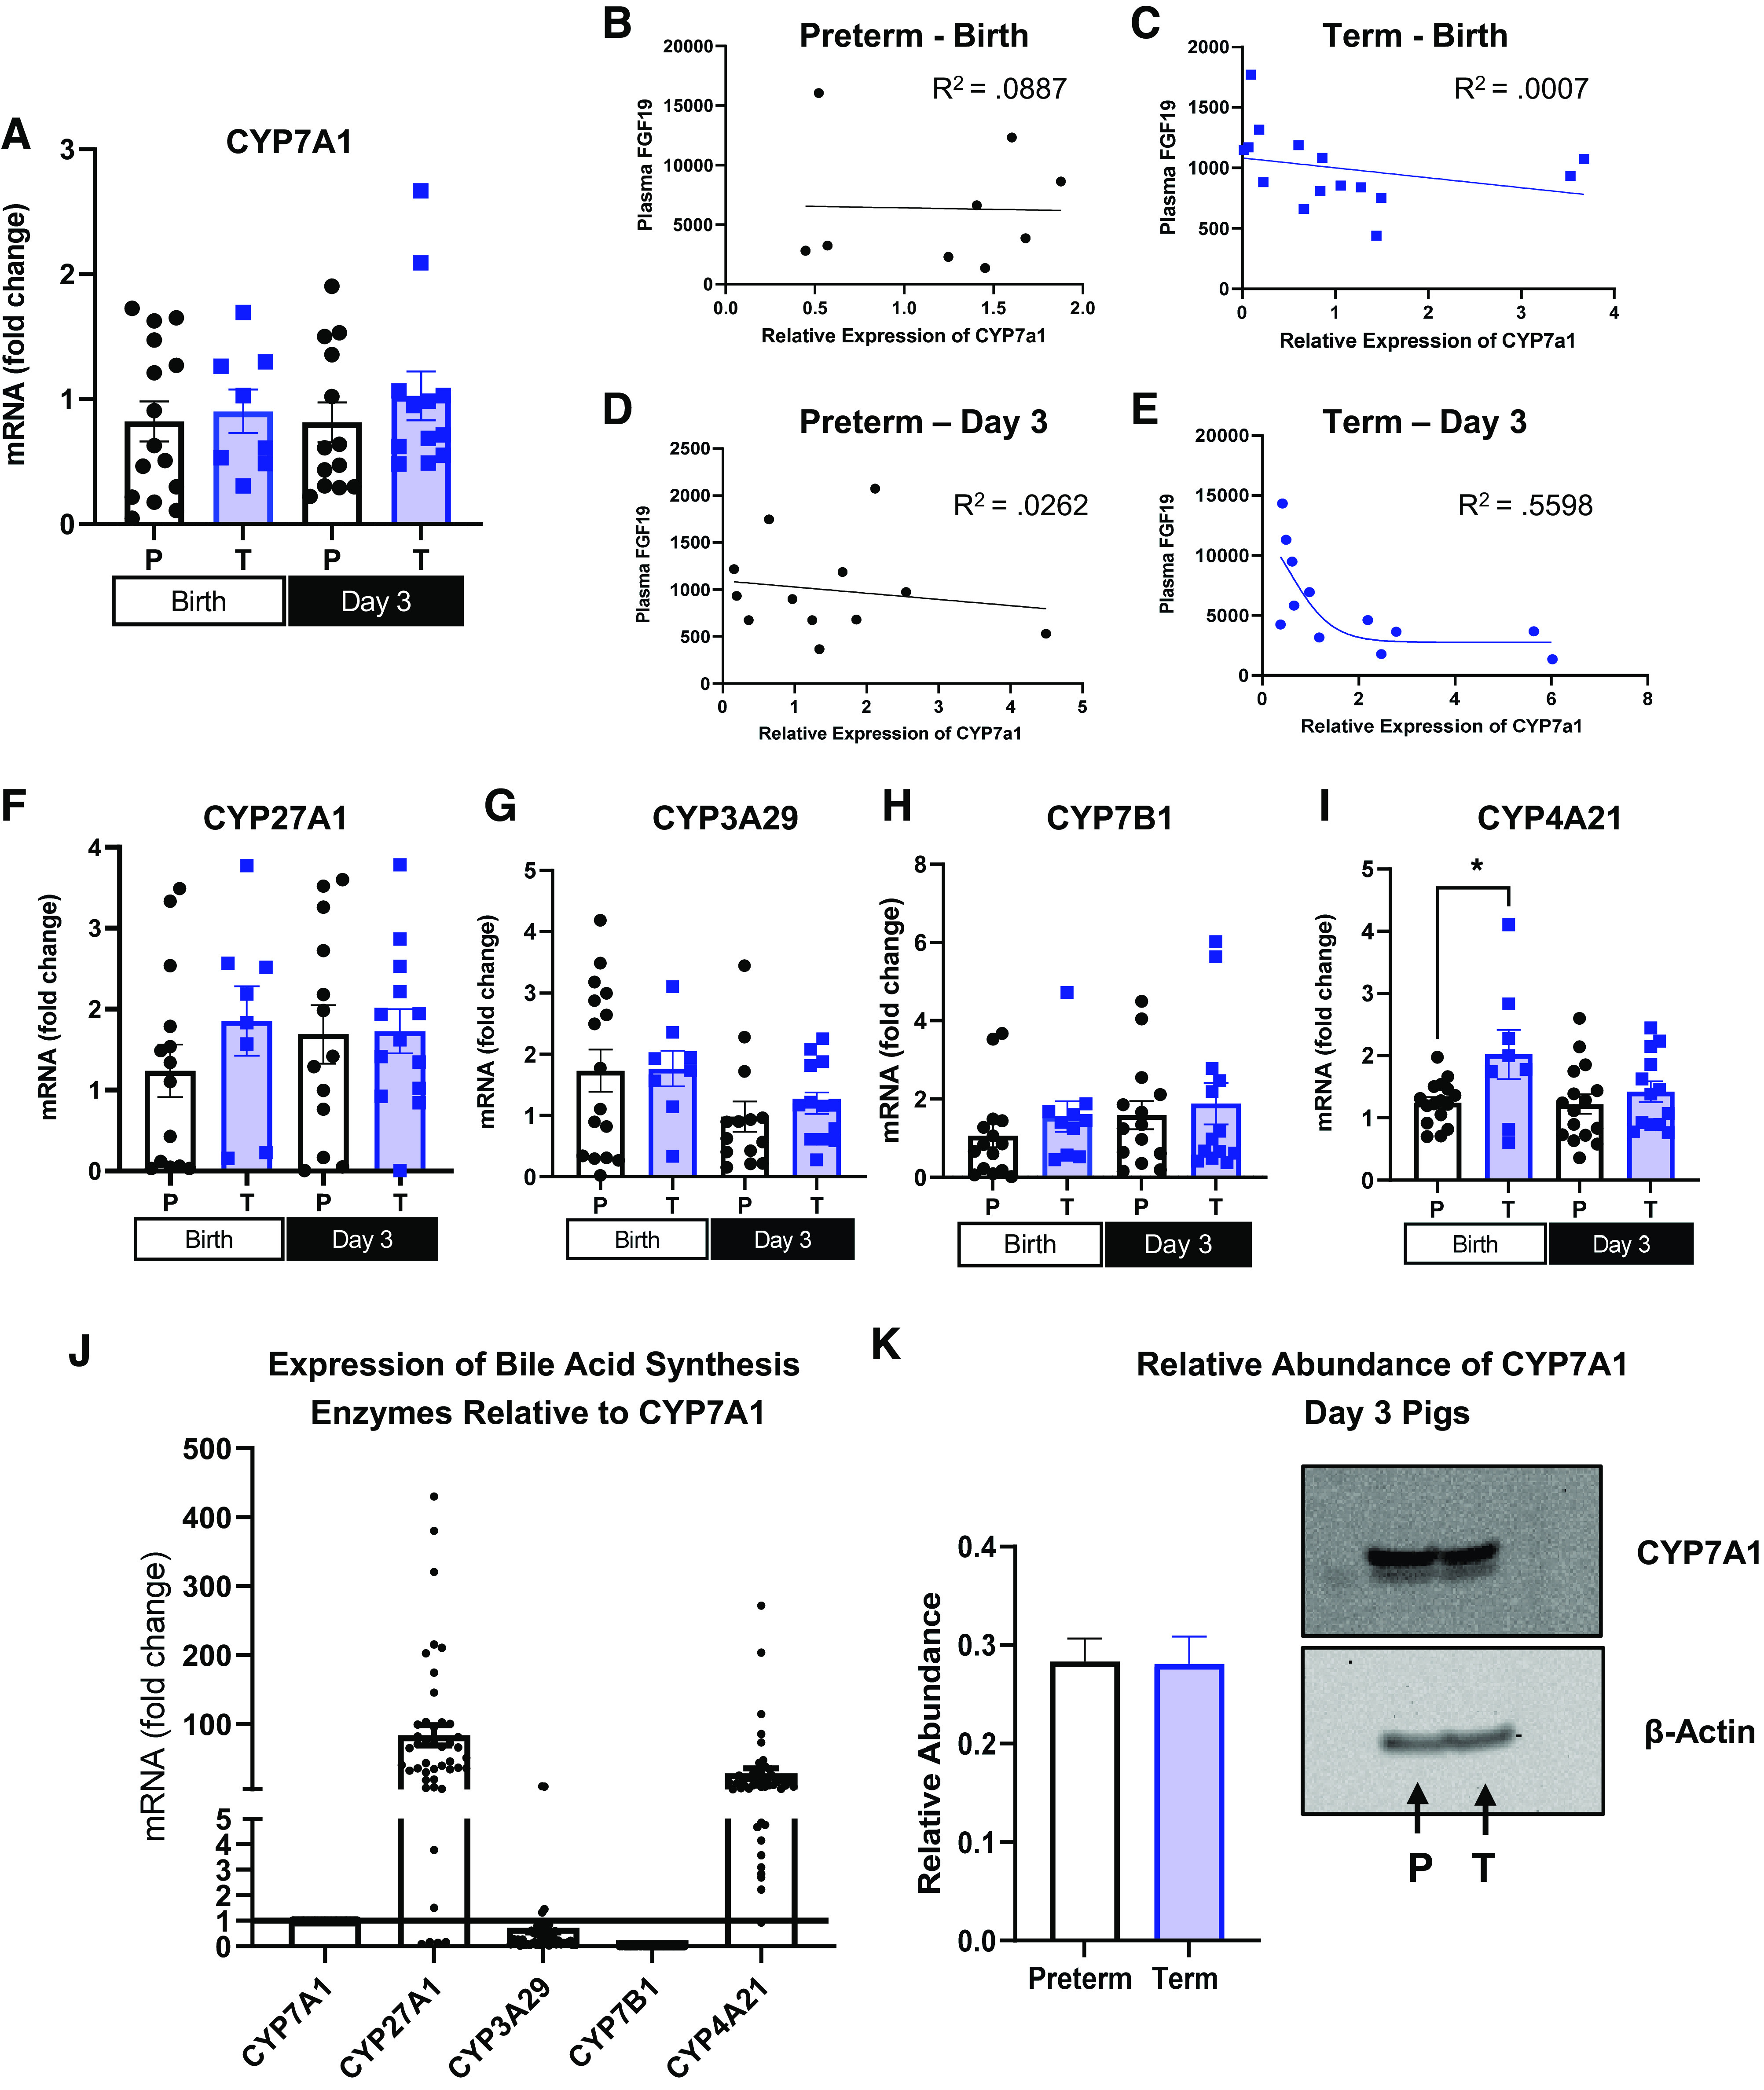
Relative expression of bile acid synthesis enzymes in liver and regression of plasma fibroblast growth factor 19 (FGF19) and expression of cytochrome P450 section 7 family A member 1 (CYP7A1). A and F–I: relative mRNA expression of CYP7A1, CYP3A29, CYP27A1, CYP7A1 and CYP4A21 in the liver tissue of term and preterm pigs at birth and on day 3 (Preterm-Birth, n = 16, Preterm-Day 3, n = 17, Term-Birth, n = 10, Term-Day 3, n = 13). J: overall mRNA expression of CYP7B1, CYP27A1, and CYP4A21 relative to CYP7A1 in neonatal pigs (n= 56). B–E: regression analysis of plasma FGF19 and relative hepatic expression of CYP7A1 in preterm pigs harvested at birth (B) (n = 16), term pigs harvested at birth (C) (n = 10), preterm pigs harvested on day 3 (D) (n = 17), and term pigs harvested on day 3 (E) (n = 17). K: protein abundance of CYP7A1 expressed relative to β-actin quantified from preterm (n = 17) and term (n = 17) liver homogenates (left) and representative immunoblots from pooled liver homogenates from pigs on day 3 of life (P = Preterm; T = Term) (right). Data are shown as means ± SE. *P (GA × Day) < 0.05. CYP3A29, cytochrome P450 family 3 sub A member 29; CYP27A1, cytochrome P450 family 27 subfamily A member 1; CYP4A21, cytochrome P450 family 4 subfamily A member 21; CYP7B1, cytochrome P450, family 7, subfamily b, member 1.