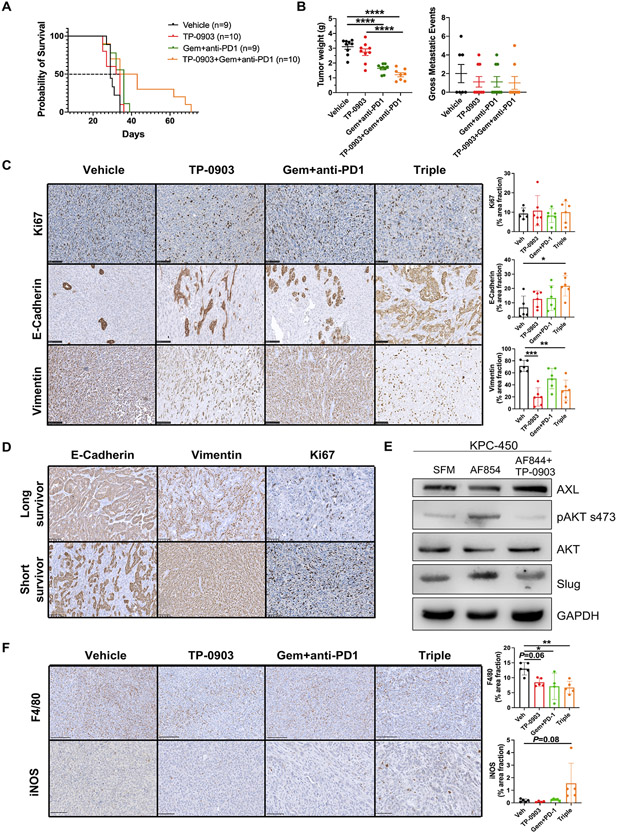
Figure 4. TP-0903 in combination with chemo- and immunotherapy leads to extended survival benefit in a refractory syngenic model of PDA.
250K KPC cells were implanted orthotopically into WT C57BL/6 mice. Therapy was initiated at day 7 post tumor cell injection. Treatments consisted of 4 groups: vehicle; TP-0903, 25 mg/kg, oral gavage, 3x/week; gemcitabine (25 mg/kg, ip, 3x/week) + anti-PD1 antibody (clone: RMP14-1, 5 mg/kg, ip, twice per week); TP-0903+gemcitabine+anti-PD1. Mice were sacrificed when they were moribund. A) Survival curve is shown. B) Tumor and liver tissues were harvested upon sacrifice and evaluated for weight and gross metastasis. Data are displayed as mean ± SEM. ****P < 0.0001; by ANOVA with Tukey’s MCT. C) Tumor tissue from each group were evaluated for Ki67, E-Cadherin and vimentin by IHC. Scale bar, 100 μm. Images were analyzed using ImageJ software. Quantification of % area fraction is shown. *, P<0.05; **, P < 0.01; ***P < 0.005; by ANOVA with Tukey’s MCT. D) Tumor tissue from long and short survivors in the triple combination therapy group were analyzed for Ki67, E-Cadherin and vimentin. Representative images are shown. Scale bar, 100 μm. Images were obtained with Hamamatsu Nanozoomer 2.0HT using NDPview2 software. E) KPC-450 cells were treated with either serum-free medium (SFM), 6 nM AF854 (activating Axl antibody), or AF854 + 4 μM TP-0903 for 1 hr. Downstream signaling and EMT targets were subsequently probed by western blot. Three biological replicates were done. F) Tumor tissue from each group were evaluated for F4/80 and iNOS by IHC. Scale bar, 250 μm. Images were analyzed using ImageJ software. Quantification of % area fraction is shown to the right. *, P<0.05; **, P < 0.01; by ANOVA with Tukey’s MCT.

