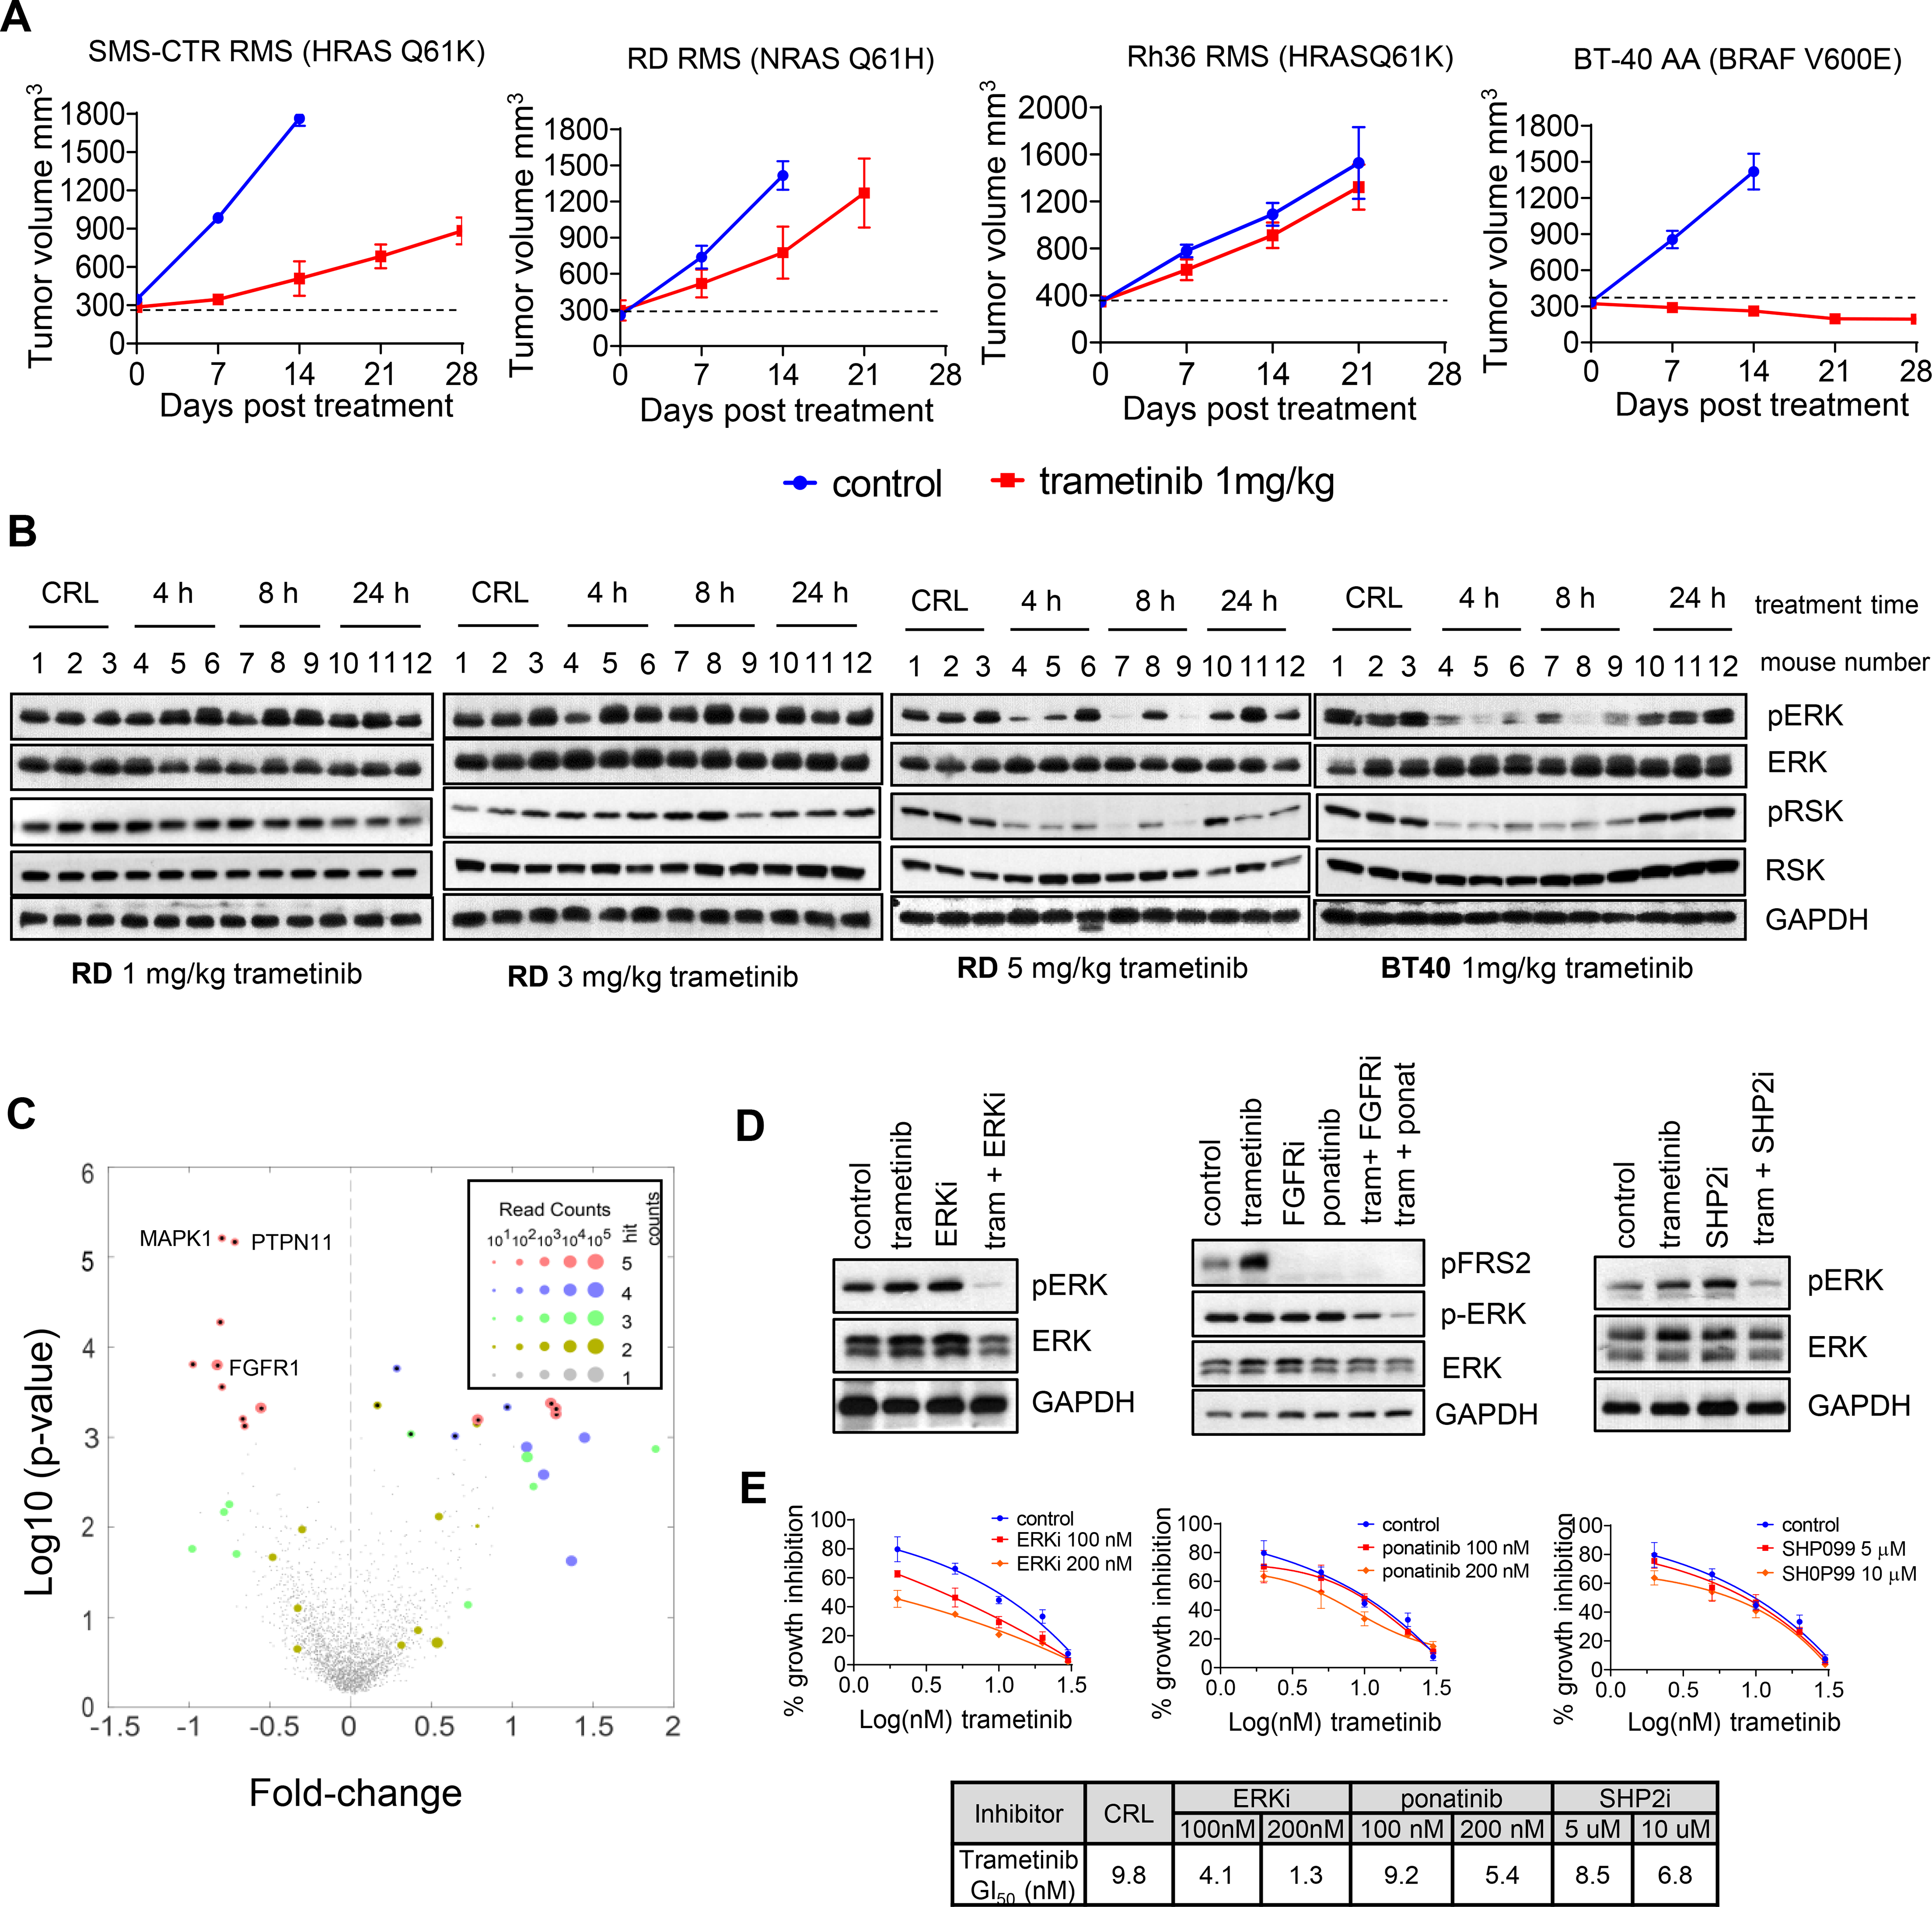
Figure 2. Single agent MEK inhibitor treatment is ineffective in H/NRAS Q61X-mutant FN-RMS tumor xenografts.

(A) Response of H/NRAS-mutant RMS tumor xenografts as compared to BRAF-V600E BT40 anaplastic astrocytoma (AA) tumor xenografts following 1 mg/kg trametinib administration. Mice bearing tumor xenografts from indicated cell lines were treated with vehicle or 1mg/kg trametinib, 7 days a week, for 28 days. Data is presented as mean tumor volume, error bars represent SEM, n=5. (B) Western blot analysis for pharmacodynamics of ERK and p90RSK1 phosphorylation in tumor xenografts from RD RMS or BT40 AA xenografts. Mice bearing RD or BT40 tumor xenografts were treated with indicated doses of trametinib, tumors were harvested at the indicated times and ERK1/2 and p90RSK1 phosphorylation was assessed by western blots. (C) Volcano plot summarizing trametinib-sensitizing CRISPR screen in RD cells. RD cells were transduced with druggable genome pLentiv2 CRISPR library. Following treatment with trametinib for 3 weeks, sgRNA region was PCR amplified and sgRNA representation determined by next-generation sequencing. Fold change for sgRNA read counts between treated and control samples was calculated and visualized using Matlab software. Y-axis: p-values of Fisher’s combined probability test of differential read counts of 5 gRNAs. Each condition was done in duplicate. (D) Western blot analysis of RD cells upon 24 h treatment with 2 nM trametinib, 200 nM pan-FGFRi LY2874455, 200 nM pan-RTKi ponatinib, 5 μM SHP2i SHP099, 50 nM ERKi LY3214996 or indicated combinations. Phosphorylated ERK1/2 (pERK, Thr202/Tyr204), phosphorylated FRS2-α (pFRS2, Tyr436) were analyzed, total ERK1/2 and GAPDH serve as controls. (E) Graphs summarizing dose-response of RD cell to increasing concentrations of trametinib alone (control, DMSO) and in combination with ERKi LY3214996 (left), pan-RTKi ponatinib (middle) or SHP2i SHP099 (right). Error bars represent SEM from three independent experiments done in triplicates. Table summary of GI50 values.
