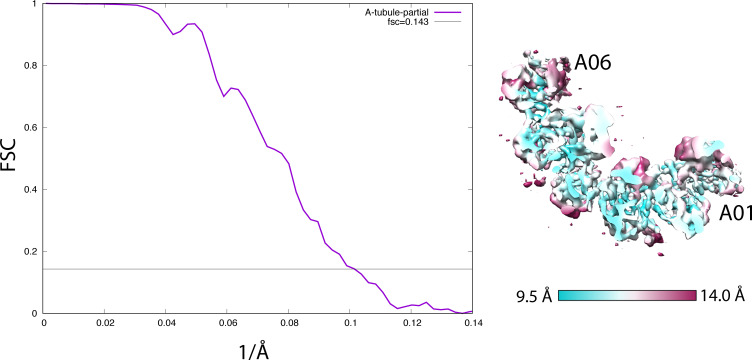
Figure S2. (Related to Fig 2). Resolution assessment by Fourier shell correlation.
Left: the FSC curve of the 16-nm repeat of the partial A-tubule from the wild type, focusing on RIB72A/B (9.9 Å). Right: the anisotropic local resolution represented by a central section from the structure.

