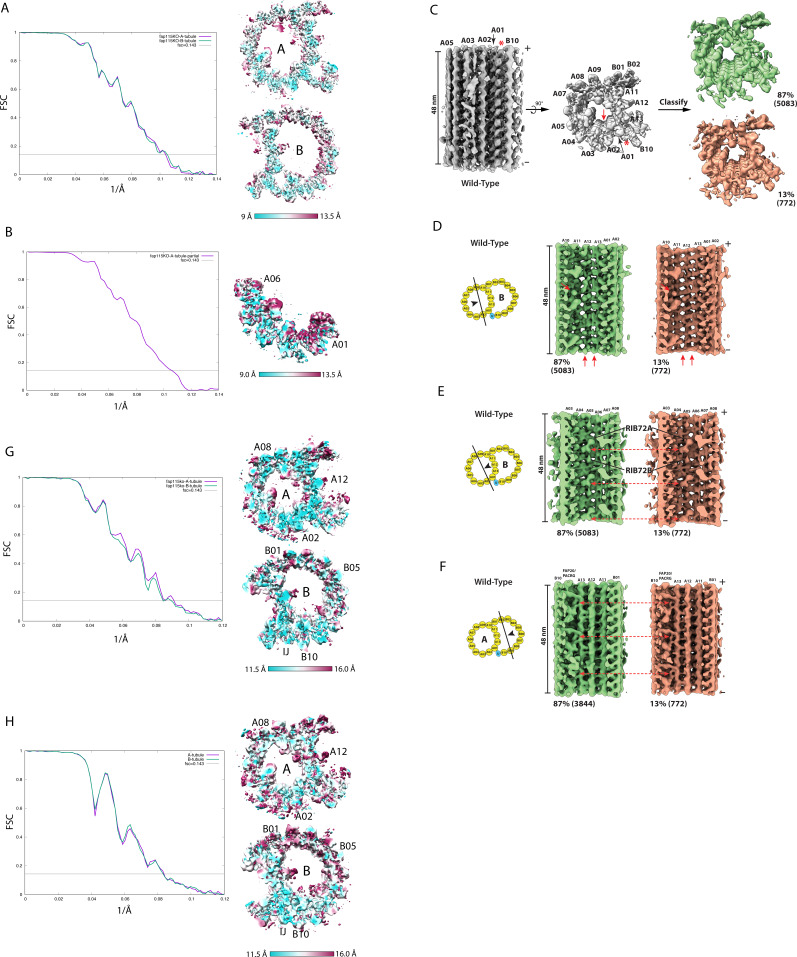
Figure S3. Structure analysis of axonemal doublet microtubule from the FAP115KO mutant and the wild-type.
(A) (Related to Fig 4A). Resolution assessment by FSC. Left: the FSC curves of the 16-nm repeat of the FAP115KO DMT A-tubule (purple, 9.6 Å) and the B-tubule (green, 9.6 Å). Right: the anisotropic local resolution represented by a central section from the structure. (B) (Related to Fig 4B). Resolution assessment by FSC. Left: the FSC curve of the 16-nm repeat of the partial A-tubule from the FAP115KO mutant, focusing on RIB72A/B (9.6 Å). Right: the anisotropic local resolution represented by a central section from the structure. (C) (Related to Fig 4C). Classification of the 48-nm repeat of the A-tubule from the wild type. The structure (in gray) is shown in two orthogonal views. A red arrow indicates the location of FAP115. A red asterisk indicates the inner junction protofilament composed of PACRG and FAP20. Classification focusing on the ribbon region pf A11∼A13 resulted in two classes as shown on the right—the 87% intact structure is in green and the 13% defective structure is in orange. The numbers of subtomograms in each class are indicated. (D, E, F) (Related to Fig 4D–F). Comparison between two class-averages from the wild-type DMT in three regions, the ribbon region, the A04A05 and the inner junction region, shows the defects is limited to the ribbon region. The viewing directions are depicted by the black arrowheads in the cartoons. The two class-averages are displayed side-by-side. The corresponding locations where the structure differences are observed in the FAP115KO mutant are indicated by red arrows. (G) (Related to Fig 4C). Resolution assessments by FSC. Left: the FSC curves of the 48-nm repeat of the FAP115KO DMT A-tubule (purple, 11.8 Å) and the B-tubule (green, 12.0 Å). Right: the anisotropic local resolution represented by a central section from the structure. (H) (Related to Fig 4C). Resolution assessments by FSC. Left: the FSC curves of the 48-nm repeat of the wild type DMT A-tubule (purple, 12.0 Å) and the B-tubule (green, 12.0 Å). Right: the anisotropic local resolution represented by a central section from the structure.

