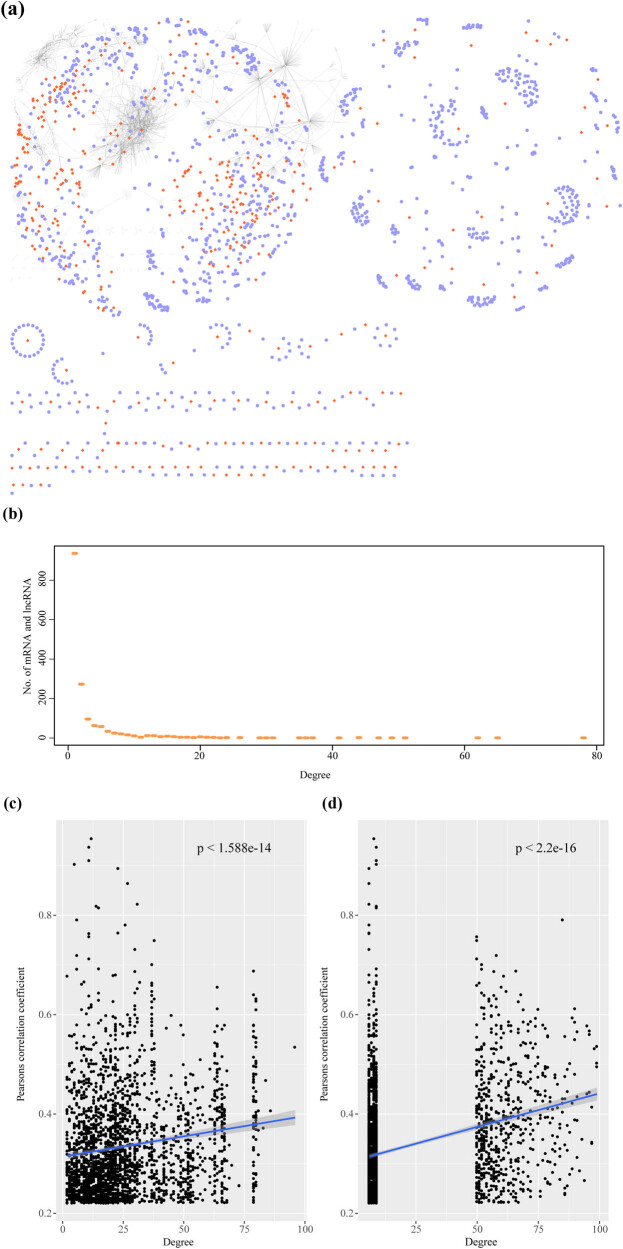
Figure 2.
Constructing HCC-specific ceRNA network and mRNA–lncRNA coexpression characteristics: (a) ceRNA network in the HCC sample. The blue node in the figure represents the gene, and the orange-red node represents the lncRNA, (b) networks degree distribution of ceRNA in HCC samples, (c) correlation between the network degree of ceRNA and coexpression of mRNA–lncRNA in HCC samples, and (d) correlation between the number of miRNAs shared by mRNA–lncRNA and the coexpression of mRNA–lncRNA in the ceRNA network for HCC samples.

