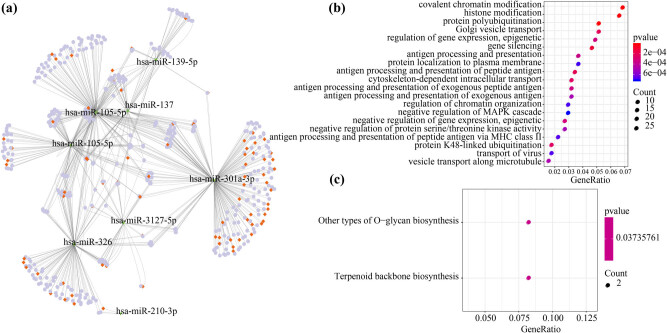
Figure 3.
Identifying dysregulated ceRNA and functional enrichment analysis: (a) the disordered ceRNA network in liver cancer, where the orange block represents the lncRNA, the green arrow represents the miRNA, and the light blue circle represents the mRNA; (b) the top 20 most significant results of 434 mRNA GO term enrichment in ceRNA network; and (c) the 434 mRNAs in the ceRNA network are enriched in two KEGG pathways, in which the color represents a significant p-value, the smaller the p-value, the darker the color, the size of the circle represents the number of genes in the enrichment pathway, and the larger the circle, the more the number of genes.

