Figure 7.
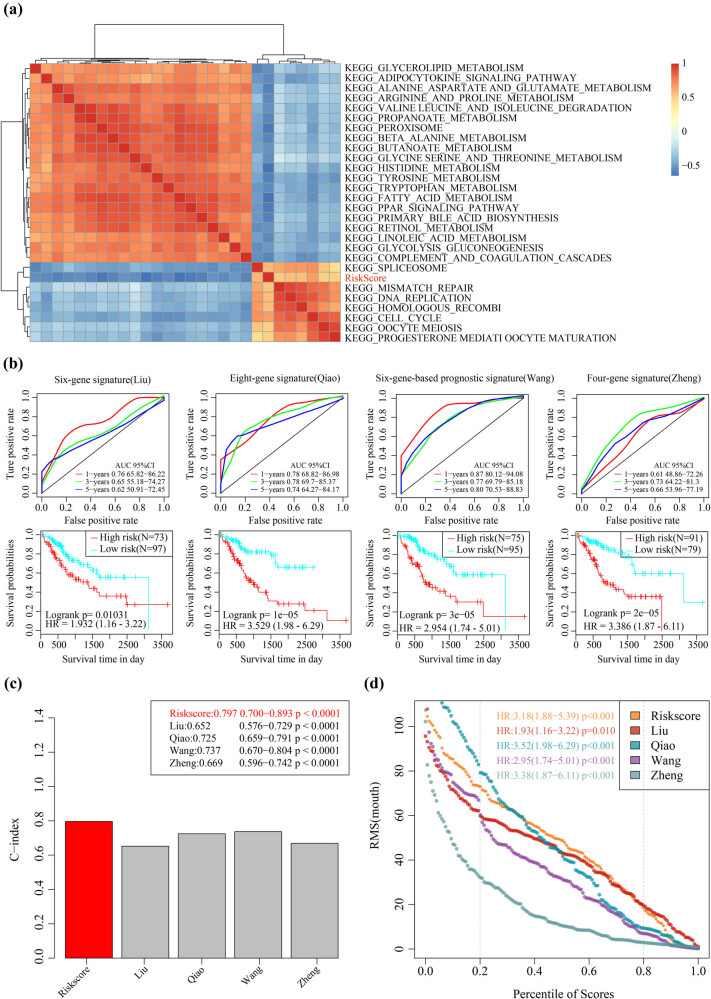
Comparing the 4-mRNA signature with the existing model and the potential-related regulatory pathway: (a) clustering of correlation coefficients between KEGG pathways with RiskScore greater than 0.5 and RiskScore, (b) AUC curve and prognosis KM curve of four models in the TCGA training set, (c) C-index of five prognostic risk models, and (d) restricted mean survival (RMS) curve of five prognostic risk models. The dashed line represents RMS time (months) corresponding to 20 and 80% percentile score, respectively.

