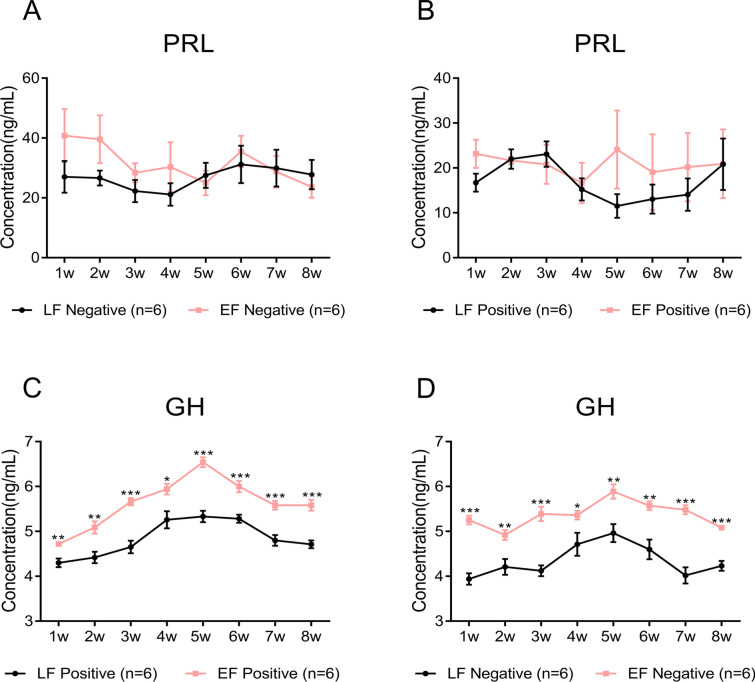
Figure 1.
The PRL and GH levels in the plasma of sampled chickens. A PRL levels in the serum of negative LF and EF chickens. B PRL levels in the serum of positive LF and EF chickens. C GH levels in the serum of negative LF and EF chickens. D GH levels in the serum of positive LF and EF chickens. Positive LF, late feathering chickens infected with ALV-J; negative LF, late feathering chickens uninfected with ALV-J; positive EF early feathering chickens infected with ALV-J; negative EF early feathering chickens uninfected with ALV-J; n number of samples. The error bars represent one standard error of the mean (SEM) (*P ≤ 0.05, **P ≤ 0.01 and ***P ≤ 0.001).

