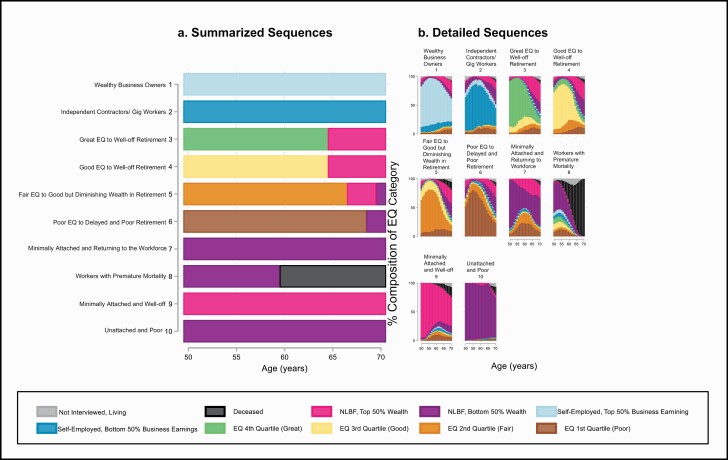
Figure 2.
Visual representation of EQ trajectories, Health and Retirement Study 1992–2016. EQ, Employment Quality; NLBF, Not in the Labor Force.This figure shows the results of sequence analysis conducted on 11,958 Health and Retirement Study respondents interviewed 1992–2016. (a) shows the most common state at a given age for each cluster while (b) provides more detail of the states assumed by each individual at a given age within each cluster.

