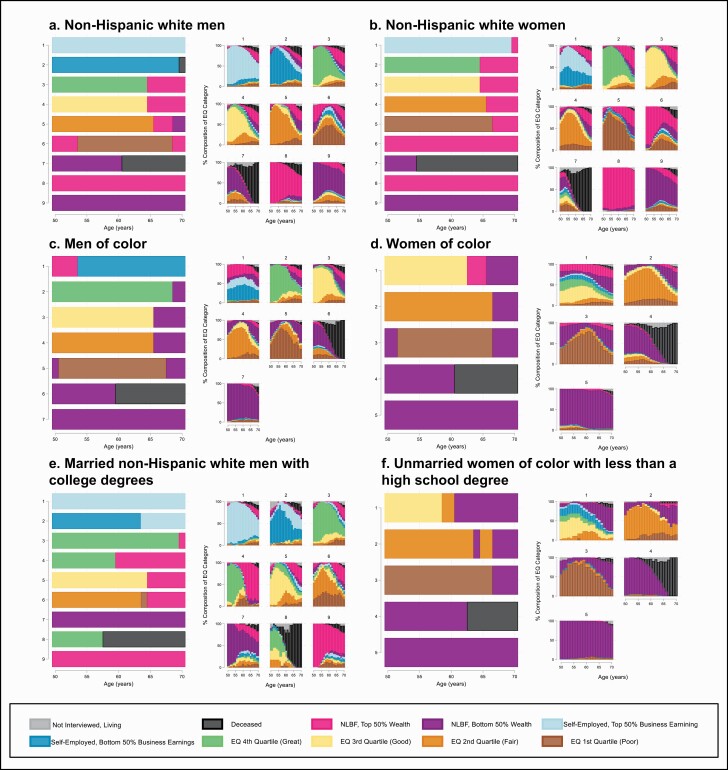
Figure 4.
Visual representation of EQ trajectories stratified by cumulative advantage, Health and Retirement Study 1992–2016. EQ, Employment Quality; NLBF, Not in the Labor Force. This figure shows the results of sequence analysis conducted in within strata of race, gender, and educational attainment on 11,958 Health and Retirement Study respondents interviewed 1992–2016. For each strata of interest, the figure on the left shows the most common state at a given age for each cluster while the figure on the right provides more detail of the states assumed by each individual at a given age within each cluster.

