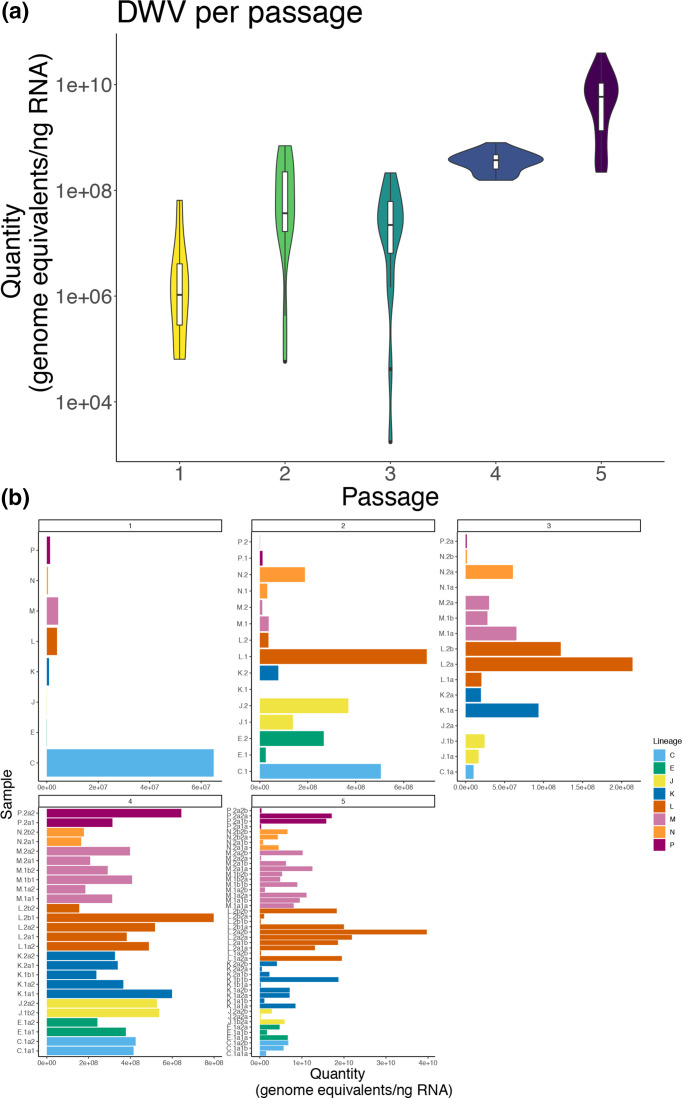
Fig. 3.
Total DWV levels significantly increase after five passages. (a) Total DWV (targeting both DWV-A and DWV-B) levels by passage determined by qPCR. DWV levels were significantly higher in Passage 4 and 5 compared to all earlier passages (Wilcox Rank Sum test, P<0.005) (b) Distribution of total DWV levels in individual samples across passages (coloured by lineage). (a, b) DWV levels in controls (no-inject, PBS) were low to no detection, and therefore are not shown here, but can be found in Fig. S1 and Supplemental Tables.

