Figure 3.

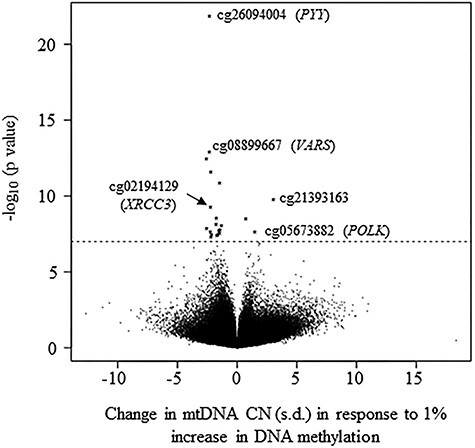
Volcano plot. A 1-s.d. change in mtDNA CN corresponds to a 1% increase in DNA methylation difference in the meta-analysis of all participants.

Volcano plot. A 1-s.d. change in mtDNA CN corresponds to a 1% increase in DNA methylation difference in the meta-analysis of all participants.