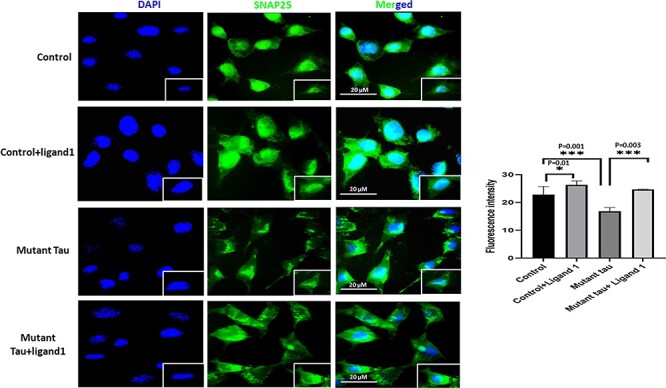
Figure 7.

Immunofluorescence analysis of SNAP 25. The effect of ligand 1 on phosphorylated tau using SNAP 25 antibody immunofluorescence analysis on four different groups of cells: 1) HT22 cells (control); 2) control+ligand 1; 3) mutant Tau and 4) mutant Tau+ligand 1. Levels were significantly decreased in Mutant tau HT22cells when compared with control (P = 0.001). Increased SNAP25 in ligand 1 treated HT22 cells with control cells (P = 0.01). Increased SNAP25 observed in mutant Tau+ligand 1 with mutant tau (P = 0.003). Scale bar 20 μm.
