Figure 9.

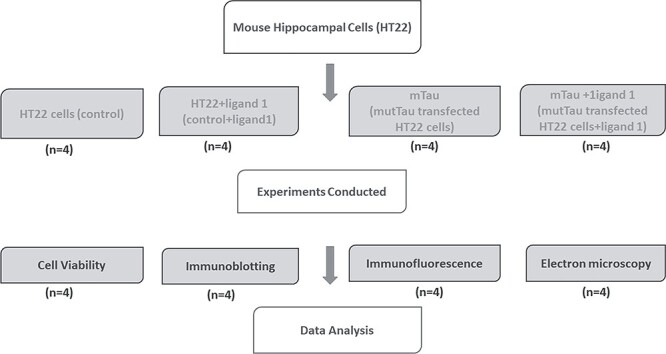
Flow chart of experimental design and conducted experiments for testing biological validation of phosphorylated tau ligand 1 in HT22 cells. Scale bar 200 μM.

Flow chart of experimental design and conducted experiments for testing biological validation of phosphorylated tau ligand 1 in HT22 cells. Scale bar 200 μM.