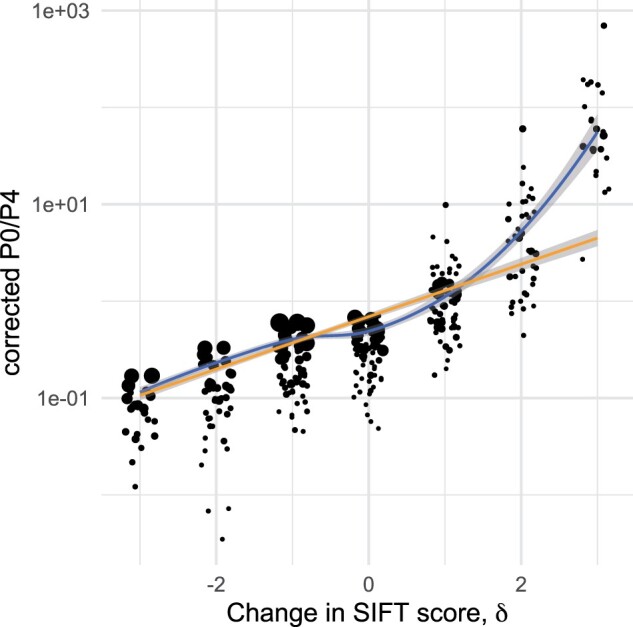
Fig. 2.

Log(P0/P4) as a function of the change in SIFT scores, δ: the orange line denotes a least square regression, the blue curve a local regression (loess). Data points are jittered horizontally for graphical convenience. Shaded gray areas around the curves denote confidence bands around each regression lines. Point size is proportional to the sample size of each SFS (number of nonsynonymous SNPs).
