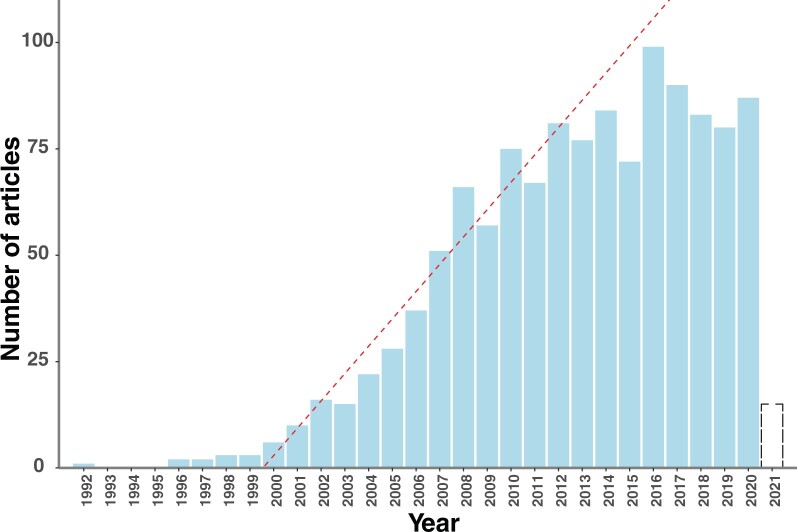
Fig. 1.
Number of publications per year with some variant of “comparative phylogeography” in the title, as referenced in the InCite database (accessed March 28, 2021). Dashed red line indicates a line of constant increase in numbers of publications from 1999 to 2008 (slope, increase of 6.42 publications per year). Dashed bar for 2021 indicates that a partial year is represented. Data are from the 1229 articles in supplementary tables S1 and S2, Supplementary Material online.

