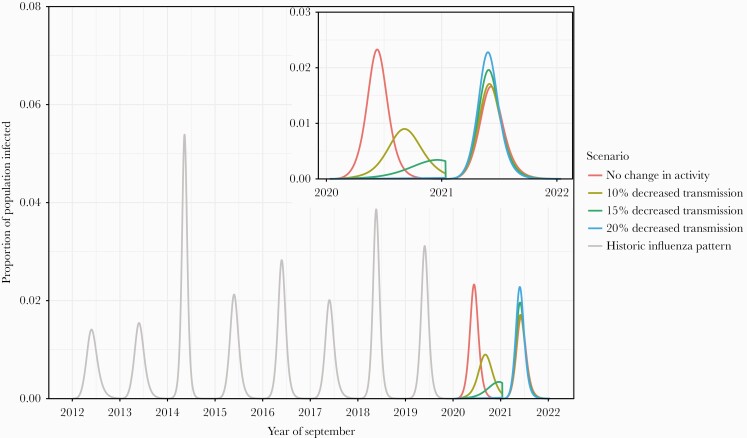
Figure 1.
Change in influenza epidemics in response to the reduced transmission in 2020–2021. Influenza seasons from 2012 to 2020 were simulated using transmission rates that represent historic influenza patterns (“historic influenza pattern” in gray). The future influenza epidemics from 2020 to 2022 were simulated with the same transmission rates (“no COVID-19 effect” in red) or with 10% (olive), 15% (green), and 20% (blue) decreased transmission rates. Trends in 2020–2022 are zoomed in a window. Abbreviation: COVID-19, coronavirus disease 2019.

