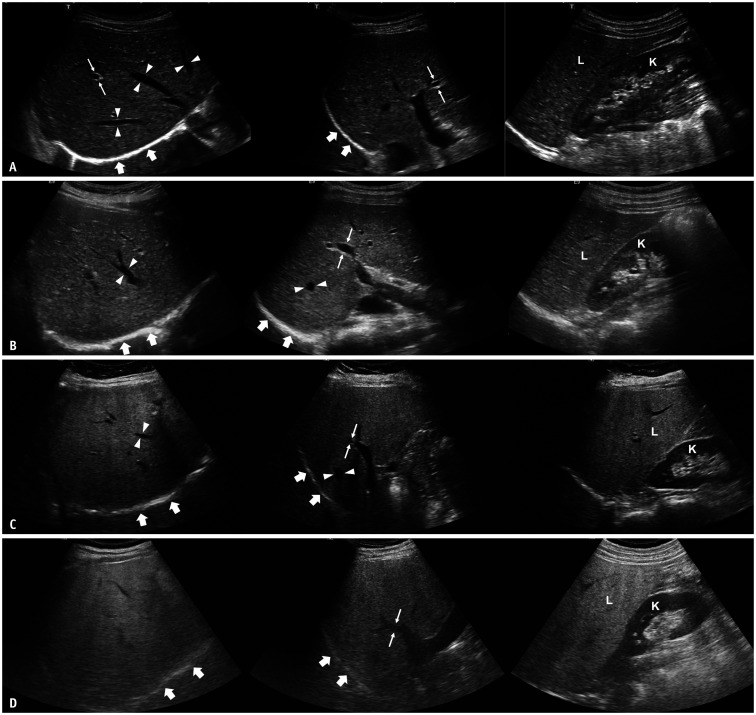
Fig. 1. Conventional ultrasound images of patients with different degrees of hepatic steatosis in subcostal view (left), intercostal view (middle), and longitudinal view with right kidney (right).
A. A 37-year-old female patient without hepatic steatosis. Echogenicity of the liver (L) is similar to that of the right kidney (K). Hepatic veins (arrowheads), wall of portal veins (thin arrows), and diaphragm (thick arrows) are all clearly visualized. B. A 20-year-old female patient with mild hepatic steatosis. Echogenicity of the liver (L) is higher than that of the right kidney (K). However, hepatic veins (arrowheads), wall of portal veins (thin arrows), and diaphragm (thick arrows) are all visualized. C. A 60-year-old female patient with moderate hepatic steatosis. Echogenicity of the liver (L) is higher than that of the right kidney (K). Hepatic veins (arrowheads) and wall of portal veins (thin arrows) are partly blurred due to ultrasound beam attenuation, but the diaphragm (thick arrows) is still visualized. D. A 49-year-old male patient with severe hepatic steatosis. Echogenicity of the liver (L) is markedly higher than that of the right kidney (K). The wall of the portal vein (thin arrows), as well as the diaphragm (thick arrows), are blurred due to ultrasound beam attenuation.

