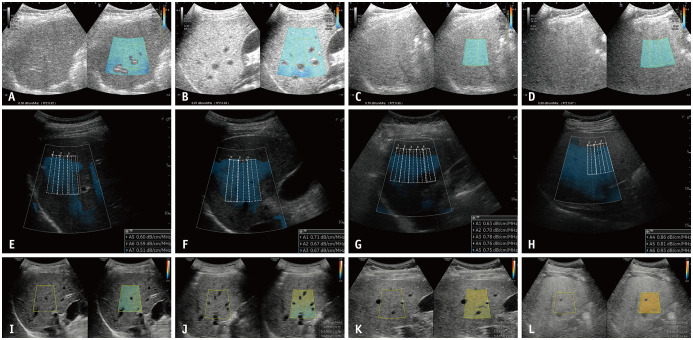
Fig. 5. Various commercialized techniques for B-mode ultrasound-guided attenuation imaging.
A-D. ATI (Canon Medical Systems) of patients (A) without hepatic steatosis, and with (B) mild, (C) moderate, and (D) severe hepatic steatosis, which were confirmed by liver biopsy. Median ACs are measured as (A) 0.56, (B) 0.67, (C) 0.76, and (D) 0.86 dB/cm/MHz, respectively. E-H. UGAP (GE Healthcare) of patients (E) without hepatic steatosis, and with (F) mild, (G) moderate, and (H) severe hepatic steatosis, which are estimated by controlled attenuation parameter. Median ACs are measured by (E) 0.59, (F) 0.67, (G) 0.77, and (H) 0.85 dB/cm/MHz, respectively. I-L. TAI (Samsung Medison) of patients (I) without hepatic steatosis and with (J) mild, (K) moderate, and (L) severe hepatic steatosis, which were confirmed by MRI-proton density fat fraction. Median ACs are measured by (I) 0.62, (J) 0.73, (K) 0.80, and (L) 0.97 dB/cm/MHz, respectively. AC = attenuation coefficient

