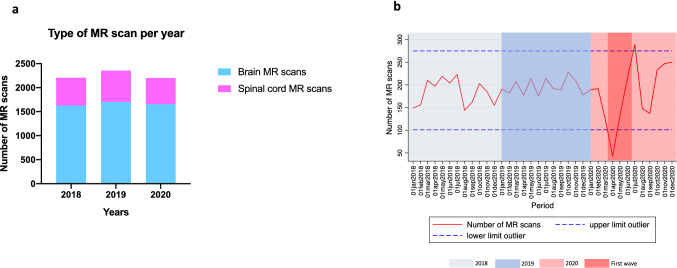
Fig. 2.
Distribution of magnetic resonance scans, according to 2020 year and control periods. a Total number of magnetic resonance scans in 2020, and control periods 2018 and 2019. b Longitudinal dynamics of the monthly number of magnetic resonances during the study period. *Dash lines represent ± 2 standard deviations the mean number of magnetic resonance scans during the whole study period

