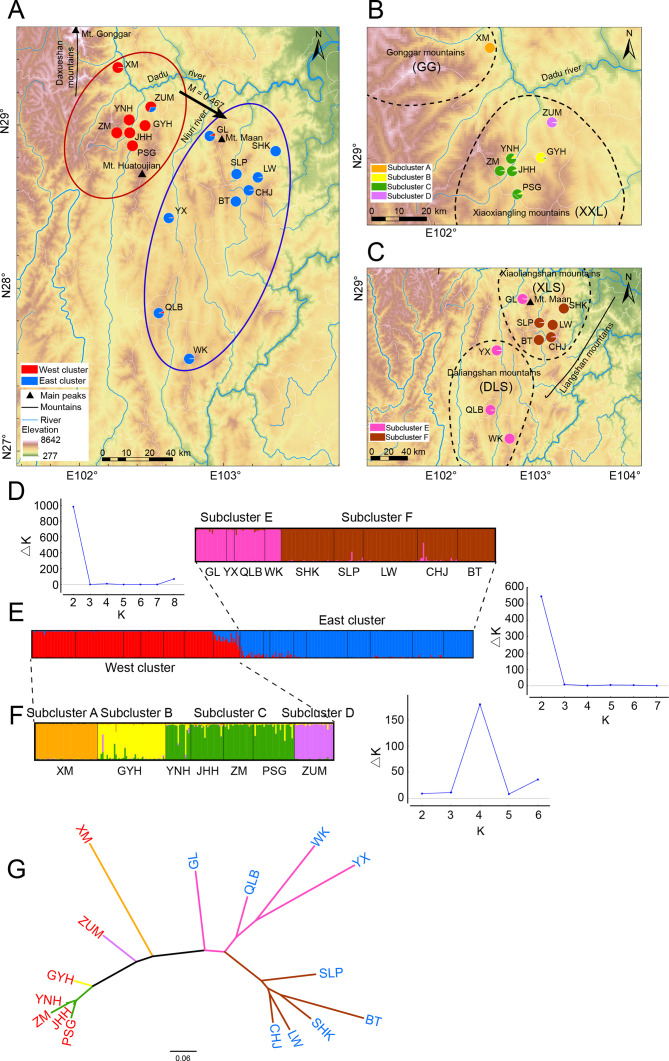
Figure 1.
Results of the Bayesian clustering analysis across Liangshantriton taliangensis distribution range
Black dashed line represents four main distribution areas of L. taliangensis (Gonggar (GG), Xiaoxiangling (XXL), Xiaoliangshan (XLS), and Daliangshan mountains (DLS)). A: Geographic distribution of two main genetic clusters, as identified by microsatellite data. West cluster (red) contains populations of XXL and GG mountains (XXL-GG); East cluster (blue) contains populations of Liangshan Mountains (LS), including DLS and XLS. Black arrows indicate gene flow. B: Geographic distribution of four subclusters of West cluster. Subcluster A (orange) contains populations of GG mountains; subclusters B (yellow), C (green), and D (purple) belong to XXL mountains. C: Geographic distribution of two subclusters in East cluster. Subcluster E (magenta) contains DLS and GL populations; subcluster F (brown) contains populations of XLS mountains except for GL. Populations are represented by pie charts, which also represent assignment probabilities between clusters or subclusters. Population codes, sampling information, and number of analyzed individuals are shown in Supplementary Table S1. D: Plot on left shows functional relationship between ΔK and K; K value corresponding to ΔKmax represents optimal grouping; right plot shows membership assignment of East cluster for K=2. E: Left plot shows membership assignment of all populations for K=2; right plot shows maximum value of ΔK corresponding to K=2. F: Left plot shows membership assignment of West cluster for K=4; right plot represents maximum value of ΔK corresponding to K=4. Black lines separate populations. G: Neighbor-joining tree of L. taliangensis populations based on DA distances. Branch color represents subclusters (A–F) results of STRUCTURE, population code color represents two main clusters.

