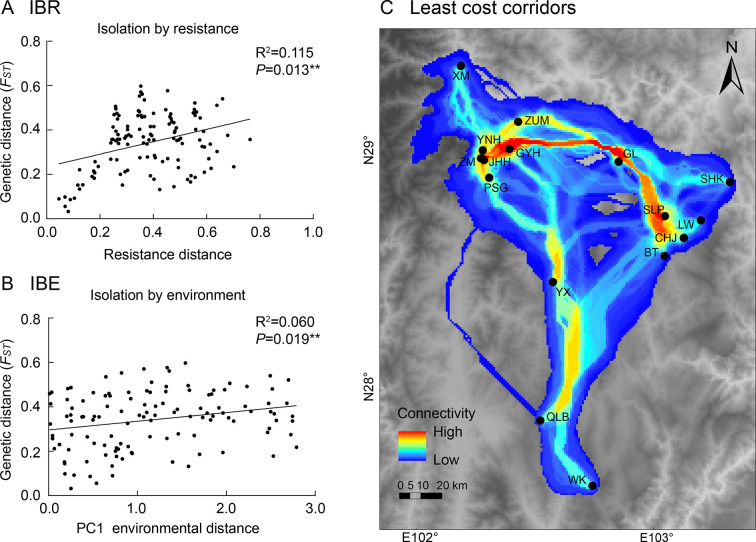
Figure 6.
Multiple matrix regression with randomization (MMRR) plots for isolation-by-resistance (IBR) and isolation-by-environment (IBE) as well as construction of least cost corridors (LCCs) forLiangshantriton taliangensis based on resistance raster
A: Correlations between genetic distance (FST) and resistance distance. B: Correlations between genetic distance (FST) and PC1 environmental distance. C: LCCs among 16 sampled populations of L. taliangensis. Warmer colors indicate higher connectivity and lower dispersal cost. Sampling sites are represented by black dots.

