
Fig. 3.
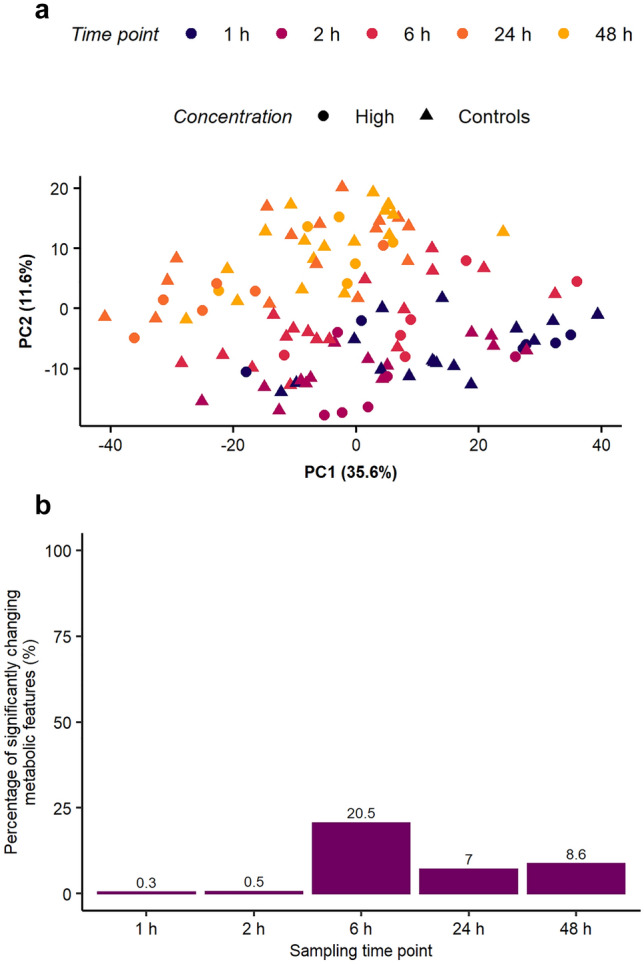
Effect of CdCl2 on the metabolome of HepaRG over a 1–48 h exposure period: a PCA score plot demonstrates that sampling time (after the media change at time 0 h) exerts a larger effect on unexposed HepaRG metabolism than exposure to the highest concentration of CdCl2, b Number of metabolic features significantly perturbed by CdCl2 at each time point after conducting one-way ANOVA, FDR-corrected p ≤ 0.05 (the values shown include interactions between control and exposed samples (low, medium, high) as well as interactions between exposure groups)