FIGURE 1.

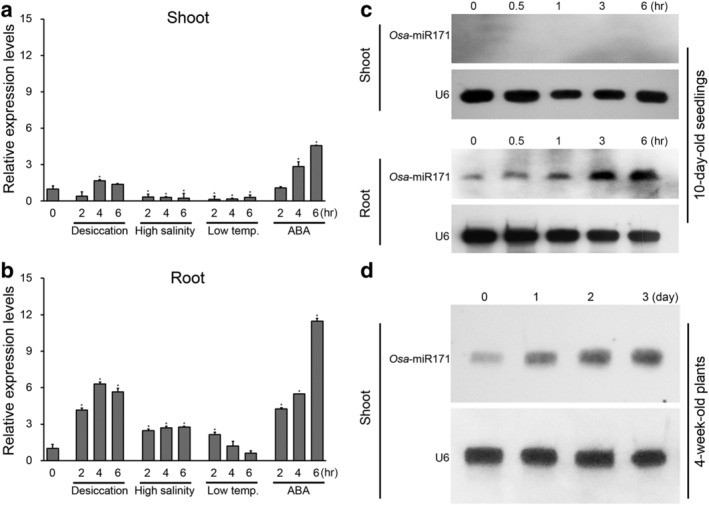
Analysis of osa‐pre‐miR171f and osa‐mature‐microRNA171a‐f (osa‐miR171) response to abiotic stress in rice. (a and b) Reverse transcription‐quantitative polymerase chain reaction (RT‐qPCR) analysis showing changes in osa‐pre‐miR171f expression levels in response to different stresses in shoots (a) and roots (b). Control plants were not treated with drought stress (0 h time). Error bars indicate SD of triplicate measurements. OsTubA2 and OsUbi1 were used as internal controls, and relative expression levels are shown as fold values. Asterisks indicate statistically significant differences between the corresponding samples and their control (p value < .01, Student's t test). ABA, abscisic acid. (c and d) osa‐miR171 expression levels in seedlings (c) and young plants (d) under drought stress. The expression level was assessed by Northern blot analysis. U6 transcript levels show equal loading of RNA. Total RNA was prepared from the 10‐day‐old and 4‐week‐old plants exposed to stresses for the indicated time periods
