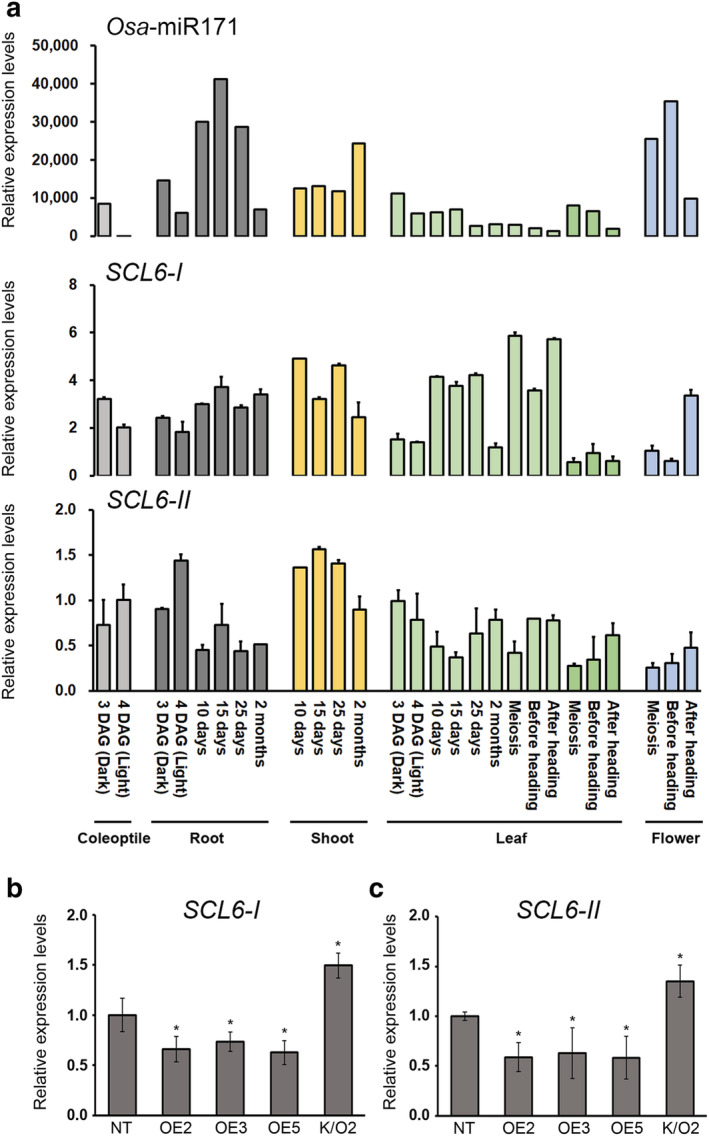
FIGURE 4.

Expression patterns of SCL6 genes at various developmental stages and in osa‐MIR171f‐overexpressing (OE) plants and knockout (K/O) mutants. (a) Expression of osa‐mature‐microRNA171a‐f (osa‐miR171) (upper panel), SCL6‐I (middle panel), and SCL6‐II (lower panel) in various developmental stages and tissues. Total RNA was extracted, and the expression level was analyzed by reverse transcription‐quantitative polymerase chain reaction (RT‐qPCR). (b) Expression level of SCL6‐I and SCL6‐II in osa‐MIR171f‐overexpressing plants and K/O mutants. The expression level was analyzed by RT‐qPCR. OsTubA2 and OsUbi1 were used as internal controls, and relative expression levels are shown as fold values. Total RNA was prepared from 4‐week‐old plants. Data represent the mean value of three biological replicates, and error bars indicate SD. Asterisks indicate statistically significant differences between the corresponding samples and their control (p value < .01, t test)
