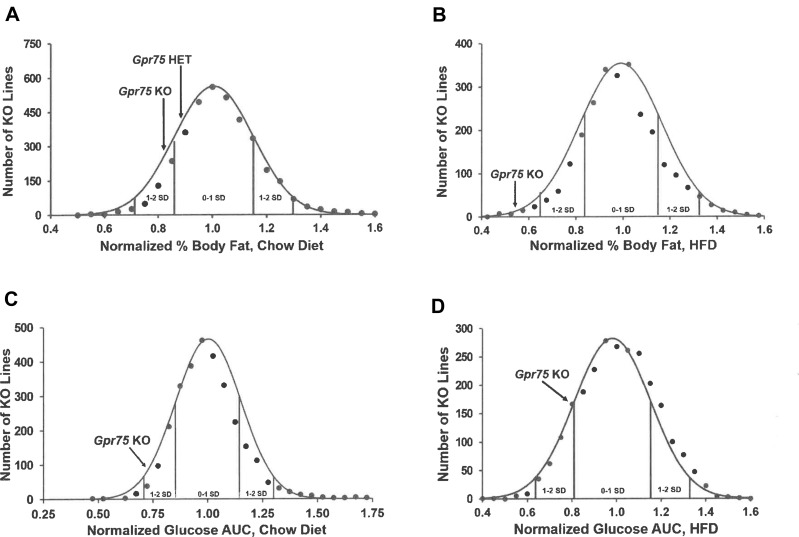
Figure 1.
Gpr75 KO mice had low body fat and improved glucose tolerance in our high-throughput screen (HTS). (A) Histogram of normalized % body fat (n%BF) values for the 3650 KO lines maintained on chow diet that were included in our HTS. Body composition analyses performed by DXA on 14-week-old mice were used to calculate n%BF for the cohort from each individual KO line. Solid points indicate actual numbers of KO lines within that mean ± 2.5% value of n%BF. Curved line shows the calculated curve. The range for 1 and 2 SD from the population mean is indicated by lines located below the curve, and the mean n%BF values for the Gpr75 KO and HET mice from the HTS cohort are indicated by arrows above the curve. (B) Histogram of n%BF values for the 2488 KO lines maintained on HFD that were included in our HTS. Body composition analyses performed by QMR on 11-week-old mice were used to calculate n%BF for the cohort from each individual KO line. The histogram is organized as in (A) above. (C) Histogram of normalized glucose AUC values calculated from OGTTs performed on 11-week-old mice from 2987 of the chow fed cohorts evaluated in our HTS. The histogram is organized as in (A) above. (D) Histogram of normalized glucose AUC values calculated from OGTTs performed on 14-week-old mice from all 2490 of the HFD cohorts evaluated in our HTS. The histogram is organized as in (A) above.

