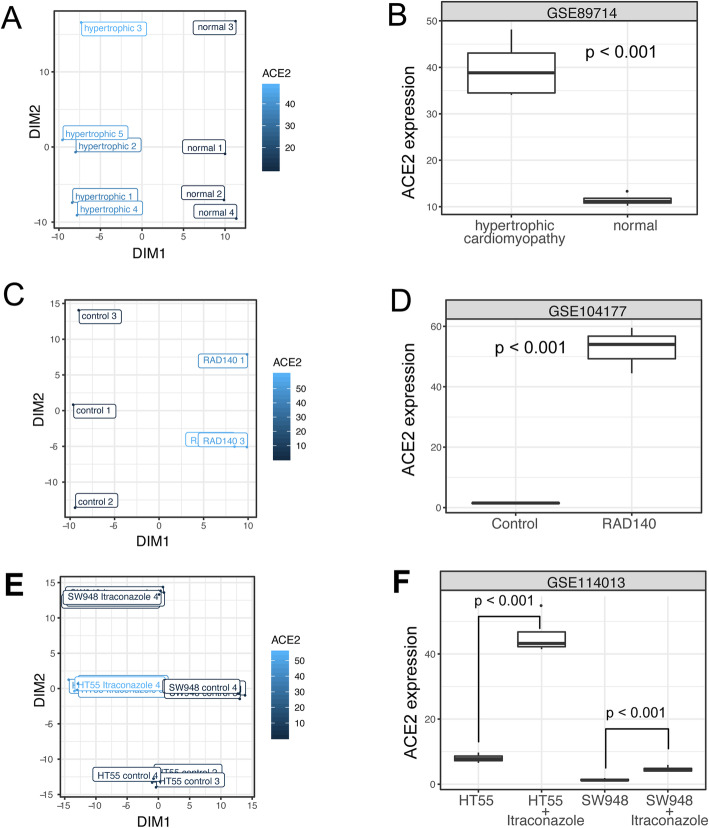
Fig. 2.
Highlighted conditions that modulate ACE2 expression. A,B Plots showing data from a study with GEO accession GSE89714. A A scatter plot showing the association between ACE2 expression and the embedded metadata. All metadata fields are concatenated for embedding. The plot only shows the sample title as labels. The labels are jittered to avoid perfect overlap. The color code represents the ACE2 expression level. B Box plot showing the ACE2 expression in normal hearts and hearts with hypertrophic cardiomyopathy. C,D Plots visualizing data from a study with GEO accession GSE104177, showing the ACE2 expression in breast cancer xenografts with or without RAD140 treatment. E,F Plots visualizing data from a study with GEO accession GSE114013, showing the ACE2 expression in two prostate cancer cell lines with or without itraconazole treatment

