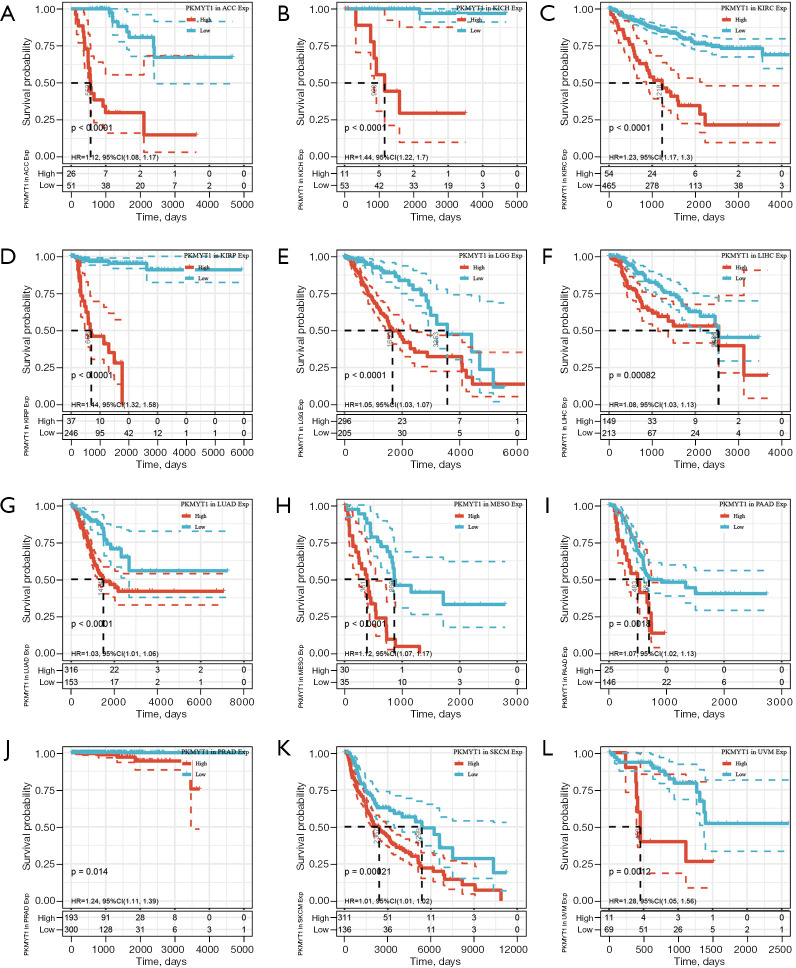
Figure 4.
Kaplan Meier curves of DSS in PKMYT1 high and low-expressing tumors in (A) ACC, (B) KICH, (C) KIRC, (D) KIRP, (E) LGG, (F) LIHC, (G) LUAD, (H) MESO, (I) PAAD, (J) PRAD, (K) SKCM, (L) UVM. KM, Kaplan-Meier; DSS, disease-specific survival; PKMYT1, protein kinase membrane associated tyrosine/threonine 1; ACC, adrenocortical carcinoma; KICH, kidney chromophobe; KIRC, kidney renal clear cell carcinoma; KIRP, kidney renal papillary cell carcinoma; LGG, lower grade glioma; LIHC, liver hepatocellular carcinoma; LUAD, lung adenocarcinoma; MESO, mesothelioma; PAAD, pancreatic adenocarcinoma; PRAD, prostate adenocarcinoma; SKCM, skin cutaneous melanoma; UVM, uveal melanoma.

