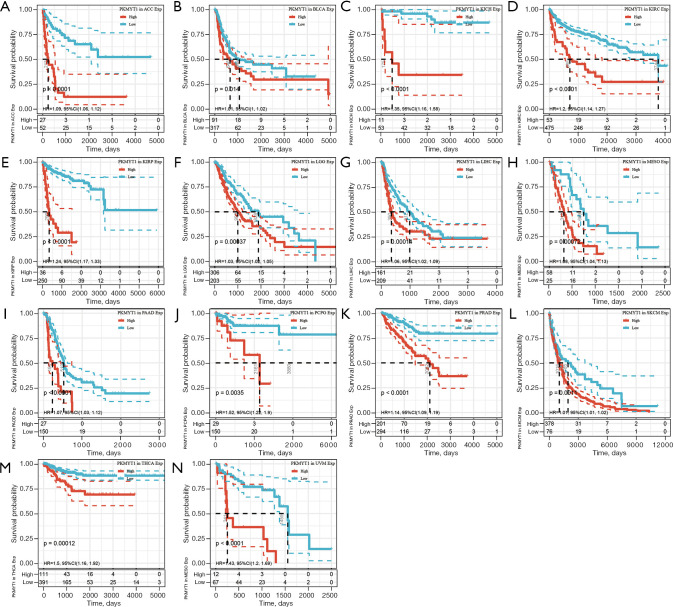
Figure 6.
Kaplan Meier curves of PFS in PKMYT1 high and low-expressing tumors in (A) ACC, (B) BLCA, (C) KICH, (D) KIRC, (E) KIRP, (F) LGG, (G) LIHC, (H) MESO, (I) PAAD, (J) PCPG, (K) PRAD, (L) SKCM, (M) THCA and (N) UVM. KM, Kaplan-Meier; PFS, progression-free survival; PKMYT1, protein kinase membrane associated tyrosine/threonine 1; ACC, adrenocortical carcinoma; BLCA, bladder urothelial carcinoma; KICH, kidney chromophobe; KIRC, kidney renal clear cell carcinoma; KIRP, kidney renal papillary cell carcinoma; LGG, lower grade glioma; LIHC, liver hepatocellular carcinoma; MESO, mesothelioma; PAAD, pancreatic adenocarcinoma; PRAD, prostate adenocarcinoma; SKCM, skin cutaneous melanoma; THCA, thyroid carcinoma; UVM, uveal melanoma.

