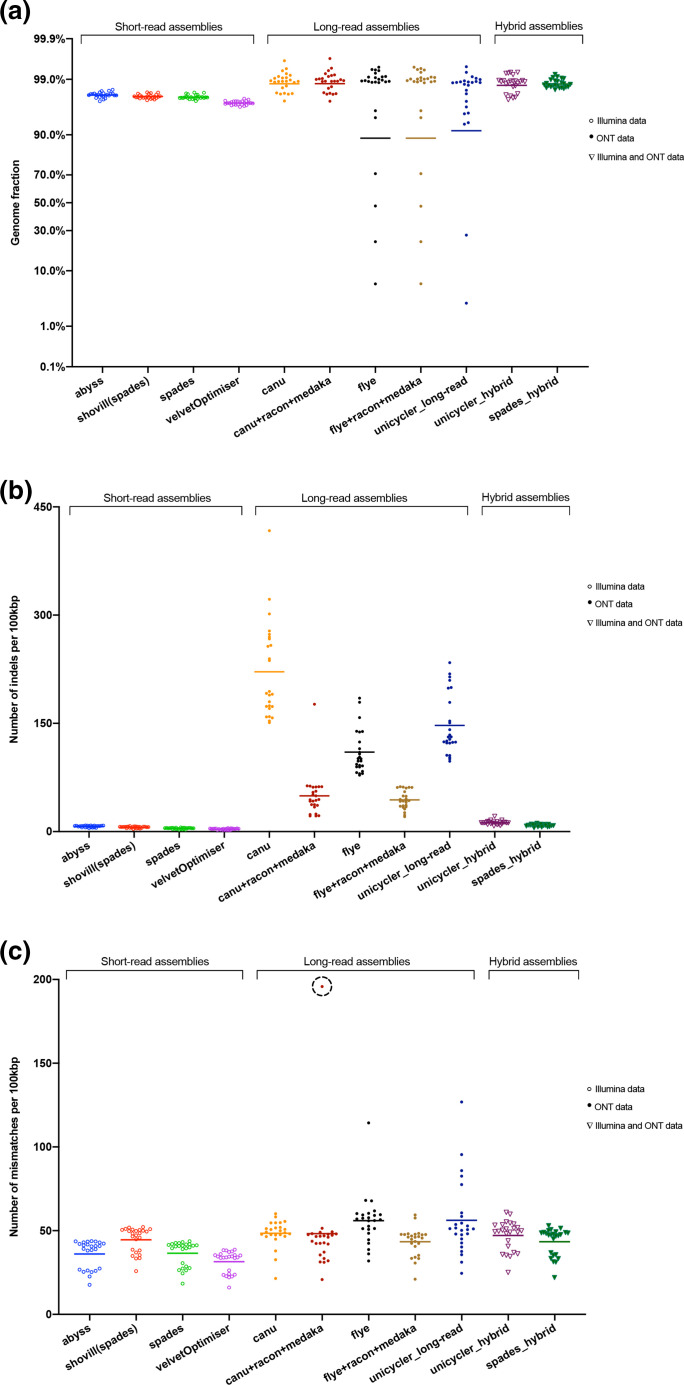
Fig. 3.
Quality assessment of the assemblers: (a) the genome fraction; (b) the average number of indels per 100 000 aligned bases; (c) the average number of mismatches per 100 000 aligned bases according to the assembly contigs mapping to the reference MTB strain H37Rv. The sample exhibiting a higher number of mismatches after correction of the Canu assembly is indicated with a dashed circle (QC-7).

