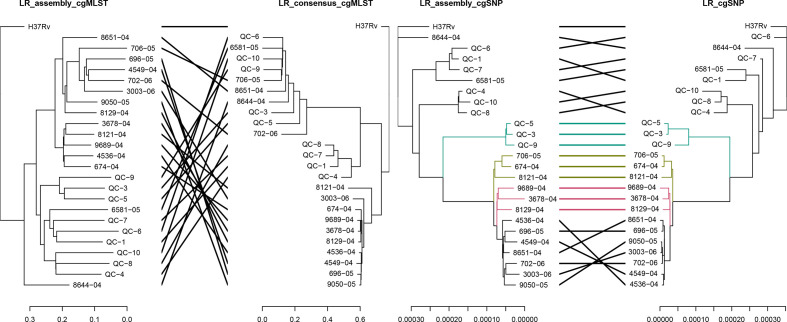
Fig. 7.
Comparison of the NJ trees of the isolates obtained with SeqSphere +cgMSLT analysis (left) and the ML trees of the isolates obtained with cgSNP analysis (right) using reference-based mapping of LRs or LR assemblies (assembler: Canu corrected with Racon and Medaka). The branches of both trees and connecting lines are coloured based on the common subtrees.

