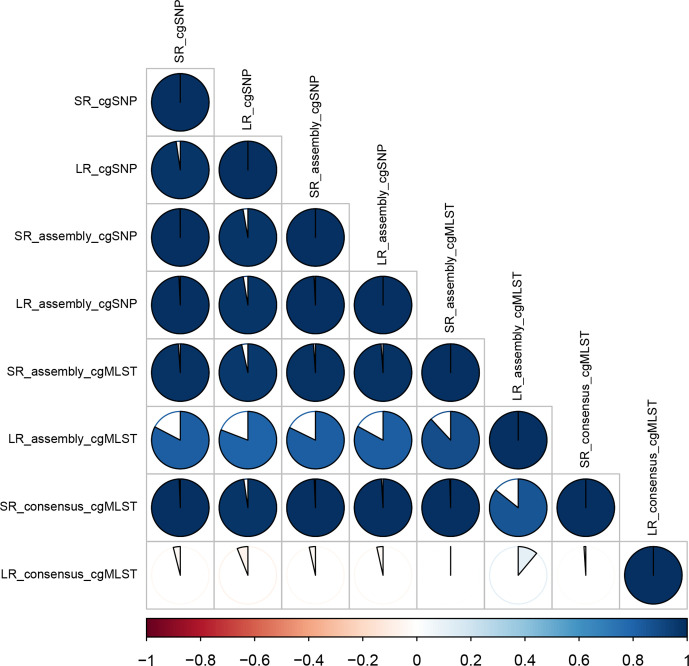
Fig. 8.
Correlation matrix of the trees visualized using corrplot v.084. The cophenetic correlation was calculated to create a correlation matrix (correlation coefficient: cophenetic) using the cor.dendlist function of dendextend v1.14.0 [SR_assembly: assembly of Shovill, LR_assembly: assembly of Canu (corrected with Racon and Medaka)]. Positive correlations are displayed on a blue scale, while negative correlations are displayed on a red scale. White means the trees are not statistically similar.

