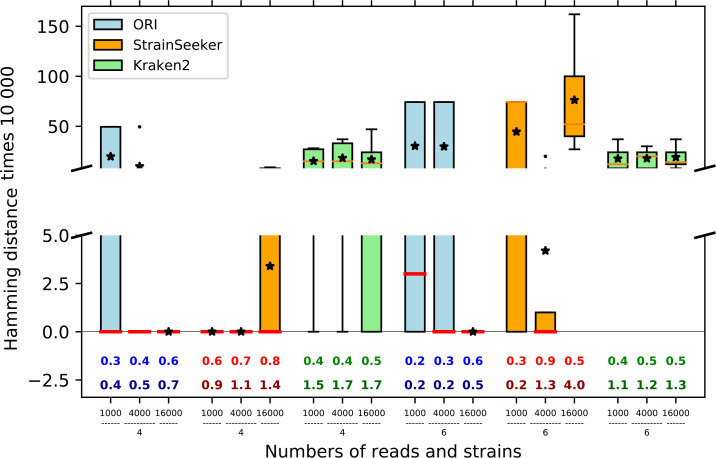
Fig. 5.
Identification of subdominant strains in a mixture of S. thermophilus strains using various numbers of reads. The Hamming distance between observed and expected strains, on the y-axis, has been multiplied by 10 000 (in blue for ORI, orange for StrainSeeker and green for Kraken 2). Matthews correlation coefficient (MCC) values are given on the first line just above the x-axis at the bottom of the diagrams, followed by the ambiguity ratio (number of strains identified/number of strains present).

