Fig. 3.
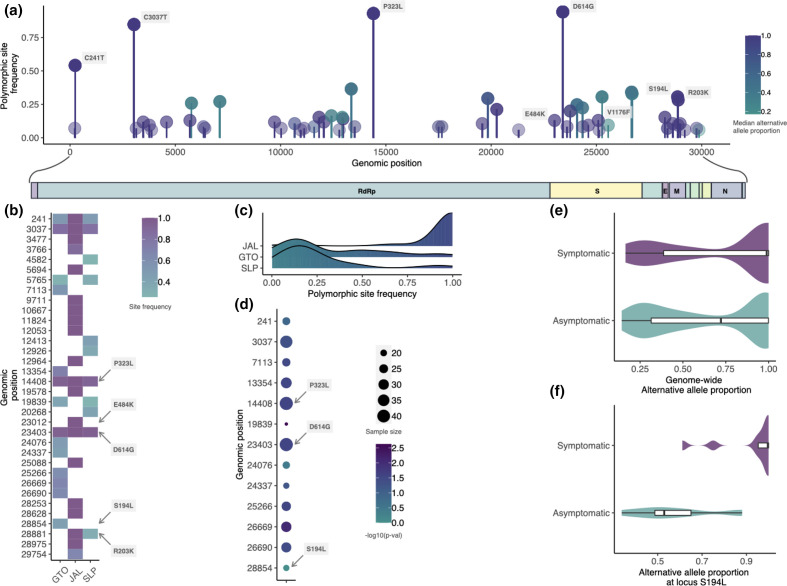
Landscape of genomic variation in central Mexico. (a) The genome-wide population frequency of SNVs plotted as lollipops. Colour reflects the per-site median allelic imbalance. (b) Heatmap showing the relative polymorphic site frequencies of the most common variants in the population on a per-locality manner basis. (c) Density plots showing the site frequency spectrum of the 59 high-quality polymorphic sites for each locality. (d) The discrete statistical association between polymorphic sites and the presence of symptoms shown as a dotplot. The size of the dots depicts the number of patients assessed while the colour denotes the −log10 of the P-values. Violin plots depict the distributions of the (e) genome-wide and (f) locus-specific (S194L) allelic imbalance for symptomatic and asymptomatic hosts within Guanajuato.

