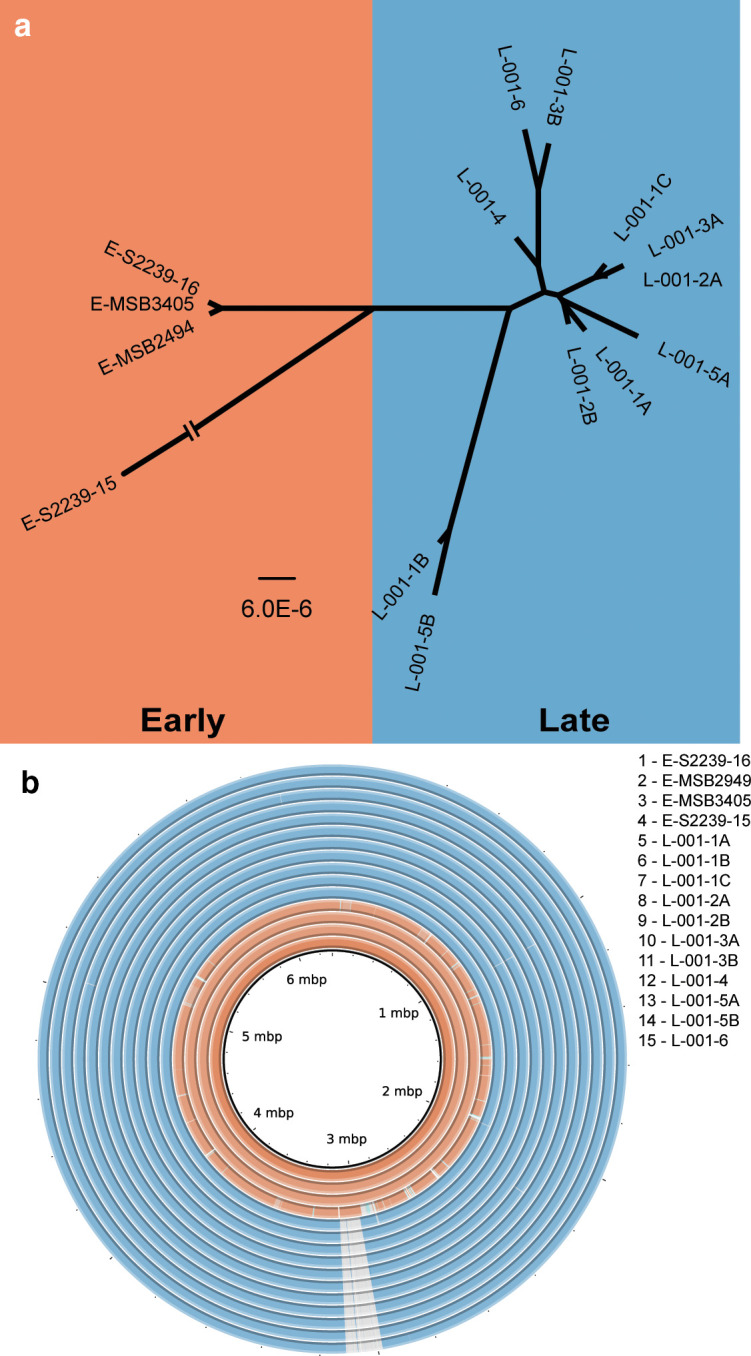
Fig. 1.

Whole genome analysis of earlier and later isolates. (a) Dendogram representing relationships between isolates, with branch lengths representing the number of nucleotide differences (bar, 6.0×10⁻⁶ nt differences per site). The strain E-S2239-15 branch is not to scale as it is distinct from all other isolates (Fig. 1). (b) Genome comparison of earlier (orange) and later (blue) isolates. Genomes were aligned using BRIG with the innermost ring being reference strain E-S2239-16. Grey hatching indicates absence of DNA that is present in the reference strain. Regions in darker shades are 100 % identical, with a lighter shade being 99 % identical.
