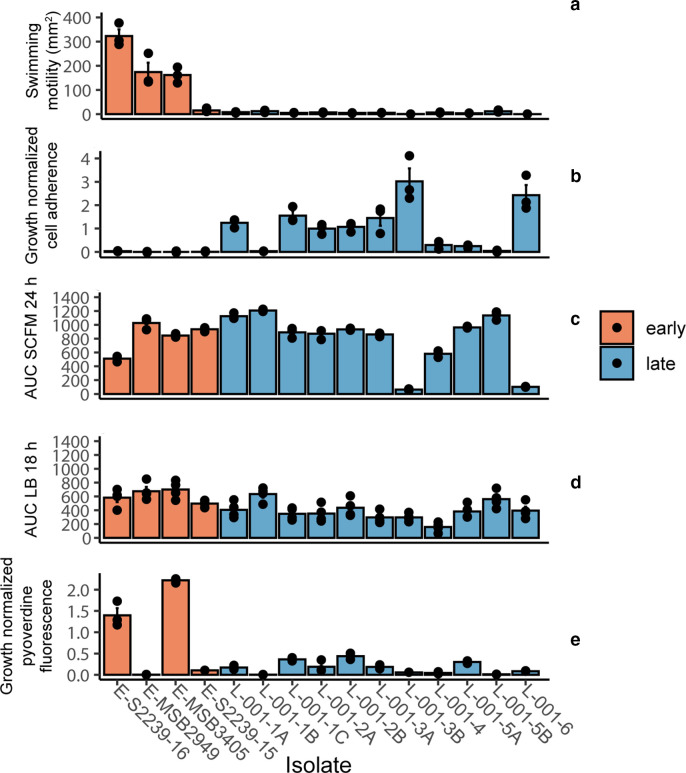
Fig. 2.
Phenotypic analysis of isolates. Earlier samples are shown in orange, and later in blue. Three biological replicates were carried out for each experiment, with each point representing a biological replicate and median values shown as crossbars. A one-way ANOVA with post-hoc Dunnett’s test was carried out between early and late isolates, and Bonferroni-corrected P-values are stated. (a) Swimming motility of isolates on M8 media containing 0.3 % agar. ***P=4.12×10⁻¹³. (b) Cell adherence in a microtitre plate assay. Crystal violet staining of standing cultures was normalized to culture OD600. *P=0.034. (c) Growth of isolates in synthetic cystic fibrosis media (SCFM), summarized as area under the curve (AUC). *P=0.045. (d) Growth of isolates in LB broth. ns, No significant change. (e) Pyoverdine production normalized to culture OD600 following growth in King’s B broth. ***P=8.96×10⁻⁷.

