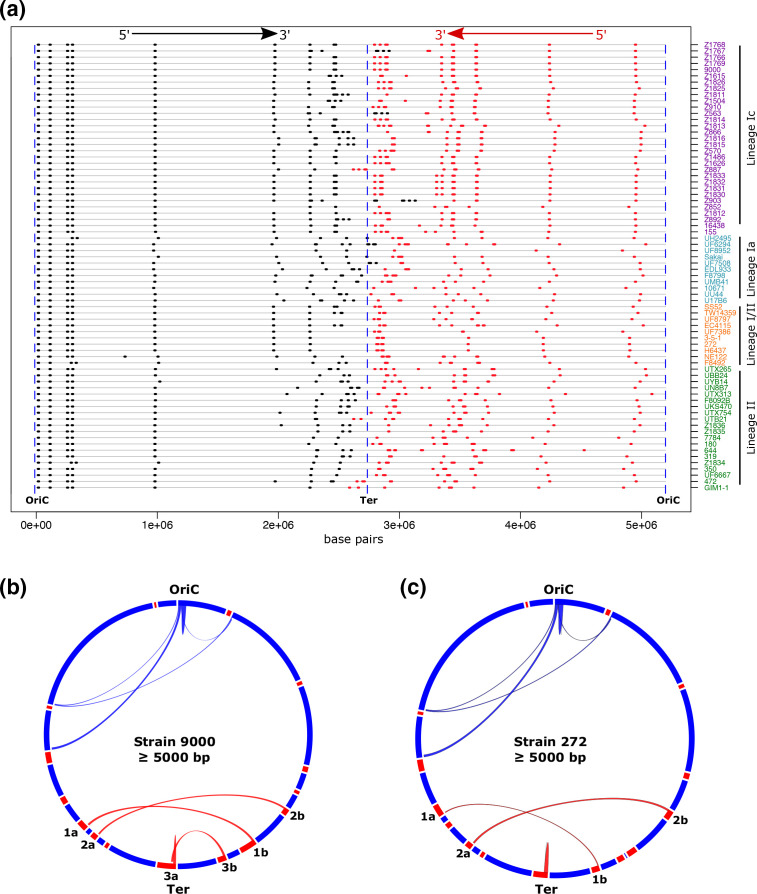
Fig. 2.
Mapping homologous regions (≥5000 bp) in E. coli O157:H7. The loci of all regions of homology ≥5000 bp (black/red) that are present as ≥2 copies per genome are mapped on the chromosomes (grey line) of strains from lineage Ic (purple), lineage Ia (blue), lineage I/II (orange) and lineage II (green) (a). The directions 5′ – 3′ of homologous sequences relative to OriC are shown with black indicating the inverse direction to red. Circos plots for lineage Ic strain 9000 (b) and lineage I/II strain 272 (c) show paired regions of homology. Prophage loci (red blocks) are shown on the respective circular genome maps (blue). Paired homologous regions are joined by arches: chromosomal (blue) and within prophage (red). Homologous prophage regions >5000 bp are paired: 1a with 1b, 2a with 2b and 3a with 3b.

